
Figure 7.
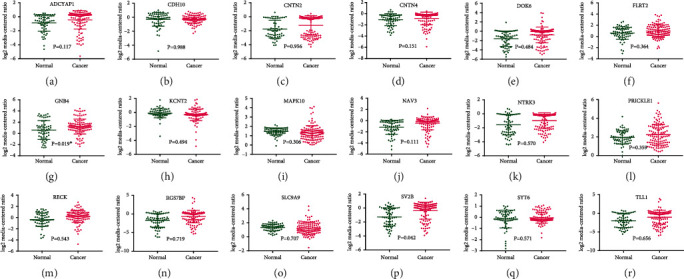
Expressions of different hub genes in GC cancers (Oncomine database). Gene expression data for Oncomine comparing the expression of hub genes in GC tissues and normal tissues (a–r). The scatter plot was drawn by GraphPad Prism 7. Tumor tissue is shown in orange, and normal tissue is shown in green. P < 0.05 was considered statistically significant.