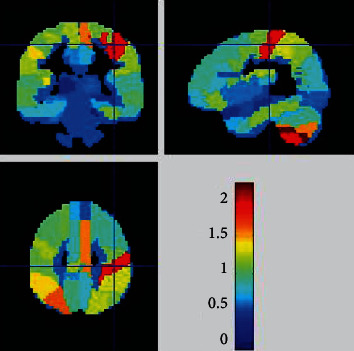
Figure 1.

A weight map of the brain regions contributing to the evaluation of the difference between the AIDS group and the control group by gray matter volume in machine learning. The larger the weight, the closer the color of the brain area is to red, and the smaller the weight, the closer the color of the brain area is to blue.
