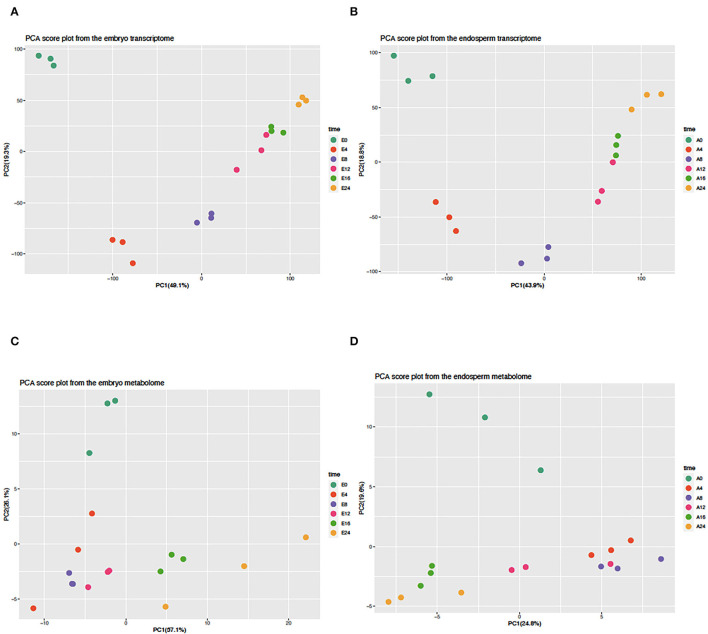
Figure 2.
Principal component analysis of embryo and endosperm transcriptomes and metabolomes. The normalized transcript (A,B) and metabolite (C,D) abundance of isolated embryos (A,C) and endosperms (C,D) were subjected to a principal component analysis (PCA) of which the first two components are shown in each graph. The percentage of explained variance is indicated along each axis. All values were centered and scaled before computing the PCA.

