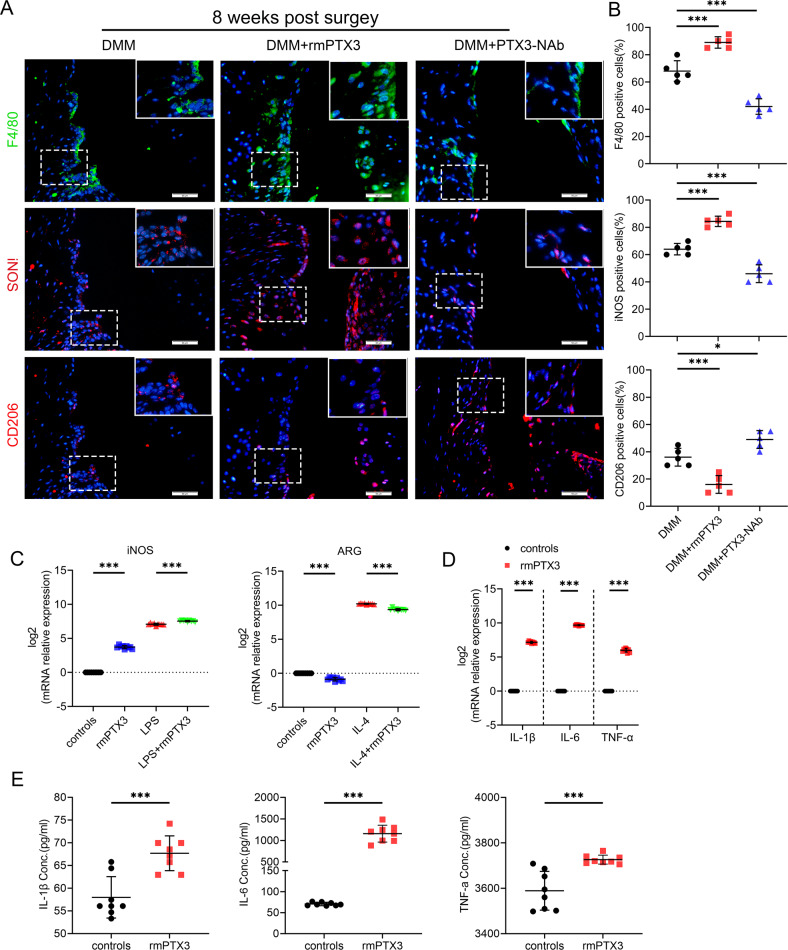
Fig. 3. PTX3 enhances M1 polarization and promotes production of inflammatory cytokines in OA synovium.
A, B IF staining and quantification of F4/80 (upper), iNOS (middle), and CD206 (lower) in synovial tissues of DMM mice treated with vehicle, rmPTX3 or PTX3-NAb for 8 weeks, n = 5 per group. Scale bar: 50 µm. C Relative mRNA expression level of iNOS and ARG in LPS-, IL-4- or rmPTX3-treated RAW264.7 cells, n = 9 per group. D Relative mRNA expression level of IL-1β, IL-6, and TNF-α in rmPTX3-treated RAW264.7 cells, n = 9 per group. E ELISA of IL-1β, IL-6, and TNF-α in the supernatants of RAW264.7 treated with rmPTX3, n = 8 per group. *P < 0.05, **P < 0.01, ***P < 0.001, ns not significant. Data are shown as means ± SD. Statistical analyses were conducted by one-way analysis of variance followed by Dunnett’s multiple comparison test (B), two-way analysis of variance followed by Sidak’s multiple comparison test (C) or unpaired t-test (D and E). Boxed area is enlarged in the top right corner.

