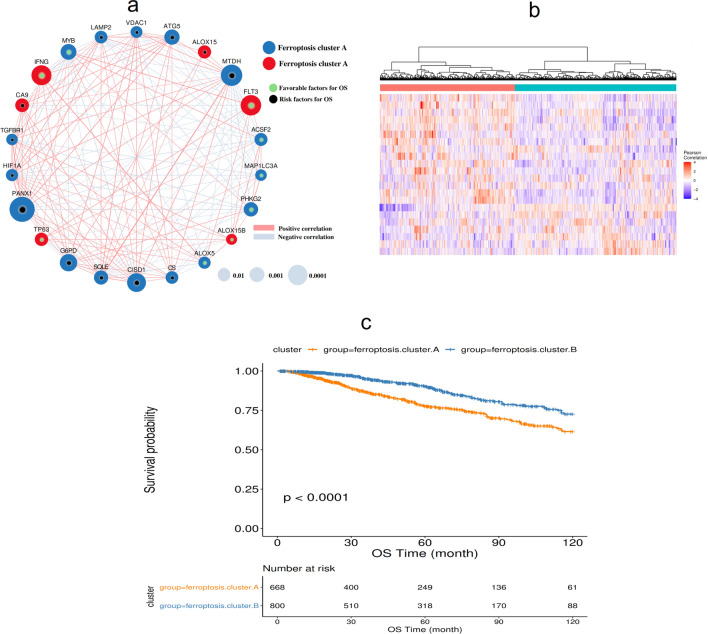
Figure 1.
Expression of ferroptosis genes in BRCA. (a) The interaction between ferroptosis genes. The size of the circle represents the impact of each gene on survival prediction (the larger the circle, the more relevant the gene to survival). The green dots in the circle represent protective prognostic factors, and the black dots in the circle represent prognostic risk factors; (b) Unsupervised clustering of ferroptosis genes; (c) Kaplan–Meier curve showing a significant difference in survival between the two ferroptosis clusters.

