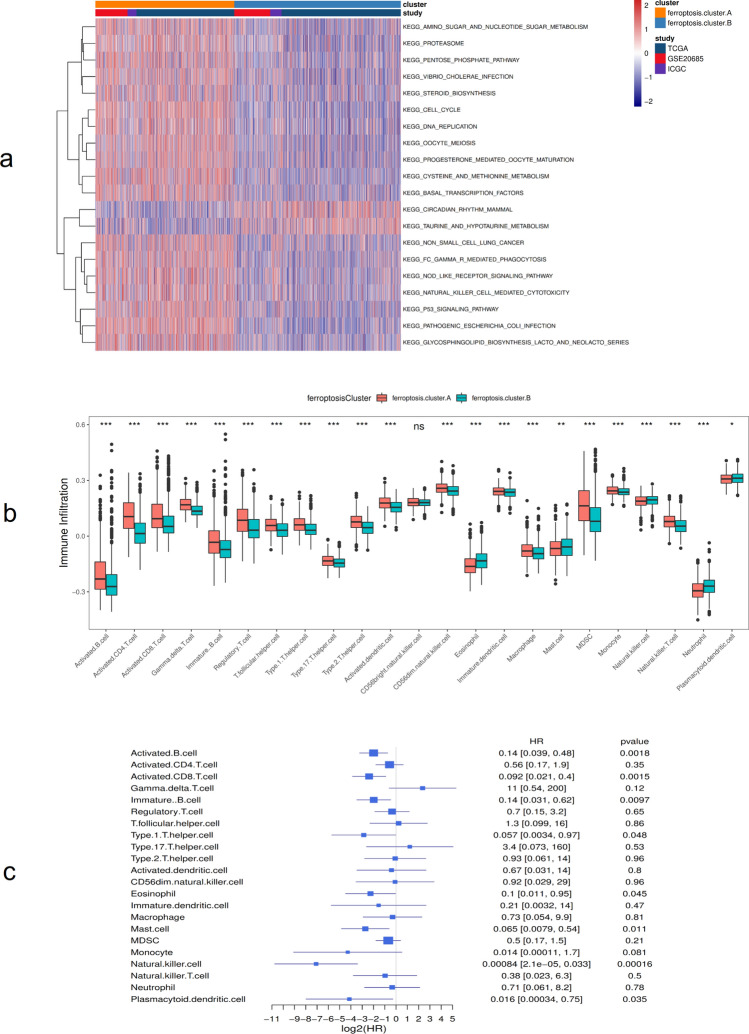
Figure 2.
Biological behavior among ferroptosis expression patterns. (a) Gene Set Variation Analysis (GSVA) enrichment analysis results (different ferroptosis clusters show the activation status of biological pathways. Red indicates activation and blue indicates inhibition). *p < 0:05, **p < 0:01, and ***p < 0:001; (b) The distribution of immune infiltration of 23 kinds of immune cells in different ferroptosis clusters; (c) Prognosis analysis of differential cells.

