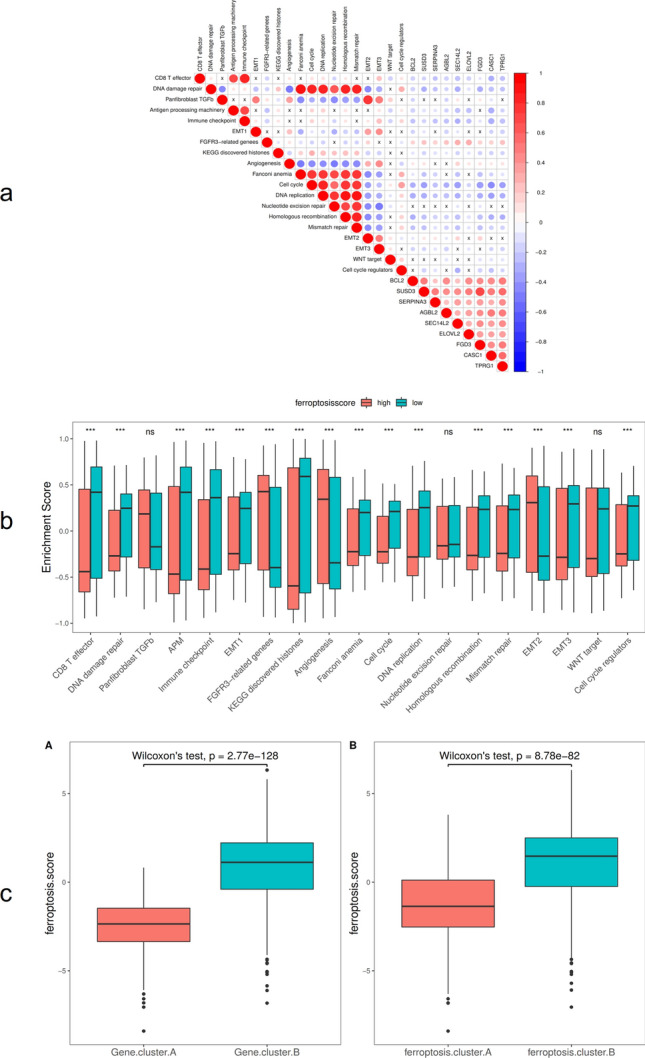
Figure 8.

Ferroptosis score and pathway correlation analysis. (a) Correlation between ferroptosis feature gene, ferroptosis score, and known biological pathways; (b) The distribution of enrichment scores of known gene characteristics in the BRCA dataset in high and low ferroptosis score groups, *p < 0:05, **p < 0:01, and ***p < 0:001; (c) The distribution of ferroptosis scores in ferroptosis gene cluster A and ferroptosis cluster B.
