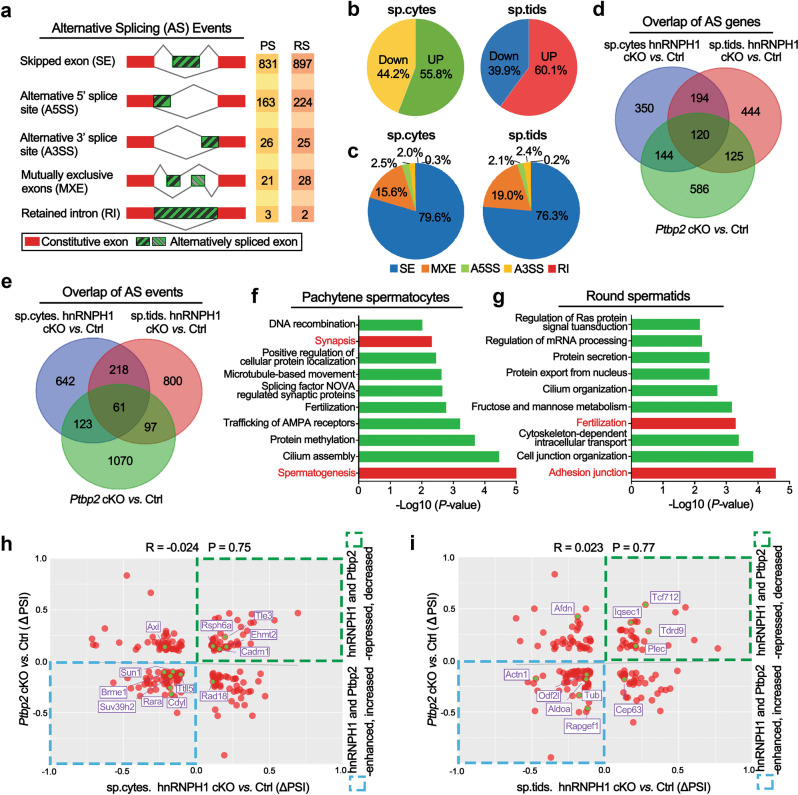
Fig. 4. hnRNPH1 and PTBP2 synergistically regulate pre-mRNA splicing in spermatogenic cells.
a Summary of differential splicing analysis performed using pachytene spermatocytes (PS) and round spermatids (RS) isolated from the control and hnRNPH1 cKO testes at P25. The numbers of predicted alternative splicing (AS) events in each category upon hnRNPH1 deletion are indicated. b Pie charts showing percentages of changed AS events identified in hnRNPH1 cKO versus control spermatocytes (left) and spermatids (right). c Pie charts representing the distribution of regulated splicing events among different splicing patterns in hnRNPH1 cKO versus control spermatocytes (left) and spermatids (right). d Venn diagrams showing overlap of abnormal AS genes (808) in hnRNPH1 cKO spermatocytes, abnormal AS genes (883) in hnRNPH1 cKO spermatids, and abnormal AS genes (975) in Ptbp2 cKO testis. e Venn diagrams show an overlap of abnormal AS events (1044) in hnRNPH1 cKO spermatocytes, abnormal AS events (1176) in hnRNPH1 cKO spermatids, and abnormal AS events (1351) in Ptbp2 cKO testis. f, g GO term enrichment analyses of genes with the same abnormal AS events caused by hnRNPH1- and PTBP2-ablation in spermatocytes (f) and spermatids (g). The top ten biological processes ranked by log10 (p value) are listed. h, i Distribution of ΔPSI values for genes with abnormal AS events in hnRNPH1 cKO spermatocytes (h) and spermatids (i). The genes involved in indicated signaling pathways and co-regulated by hnRNPH1 and PTBP2 are marked in red.

