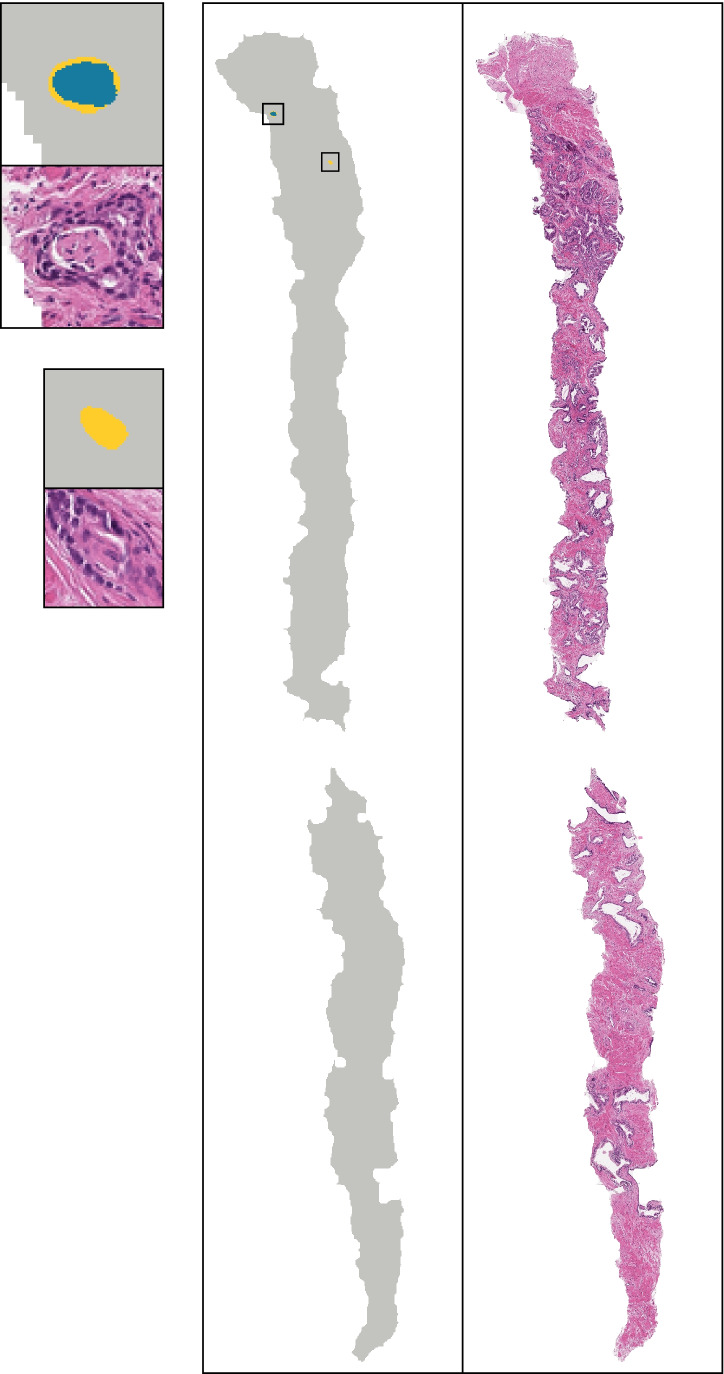
Fig. 3.
Illustration of PNI segmentation on the biopsy core with IoU (0.51) closest to the overall mean IoU (0.50) reported. The H&E stained biopsy (right) and the corresponding predicted pixel-wise classification and ground truth (middle), and two highlighted regions (left) are shown. The regions both annotated by the pathologist and classified as positive by the network (i.e., the intersection) are colored blue, and the regions not annotated but still classified positive by the network are yellow. In this example, there were no regions annotated but not classified as positive. All pixels positive by either the pathologist or the network form the union (i.e., the denominator in the IoU)

