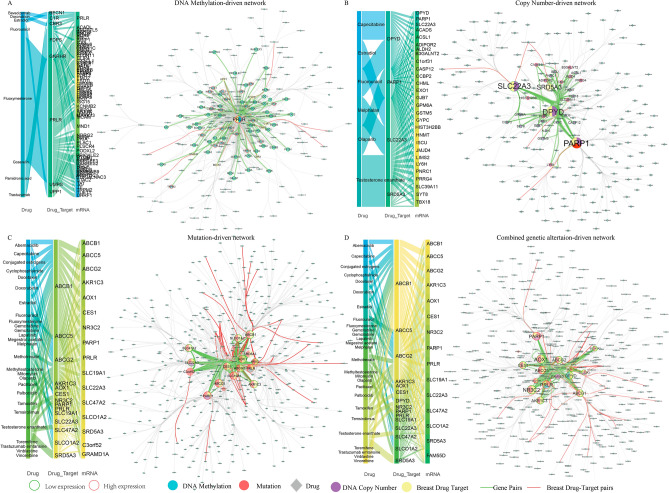
Figure 2.
Genetic alteration-driven networks. (A) DNA methylation-driven network. (B) Copy number-driven network. (C) Mutation-driven network. (D) Combined genetic alteration-driven network. The node size represents the degree of genes. The green edges represent gene pairs between genetic alteration-driven genes and drug target genes. The red edges represent gene pairs between genetic alteration-driven genes and target genes of breast cancer drugs. The node fill color indicates the genetic alteration and the node edge color corresponds to expression difference.

