
Fig. 3. Quantification of disorder by low-temperature magnetisation.
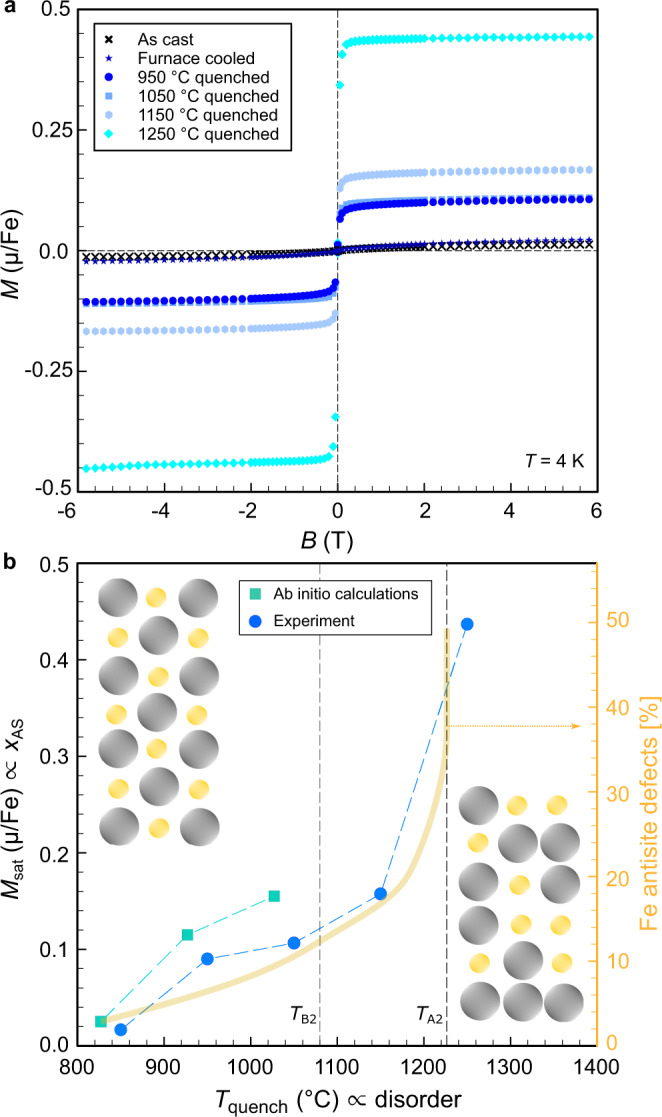
a Field-dependent magnetisation of Fe2VAl at T = 4 K for different quenching temperatures. b Experimental and calculated saturation magnetisation versus quenching temperature. The insets show a sketch of atomic disorder, increasing with Tquench. Right scale shows the calculated concentration of Fe antisite defects (yellow curve) from Fig. 1b, rescaled to the experimental transition temperatures TB2, TA222.