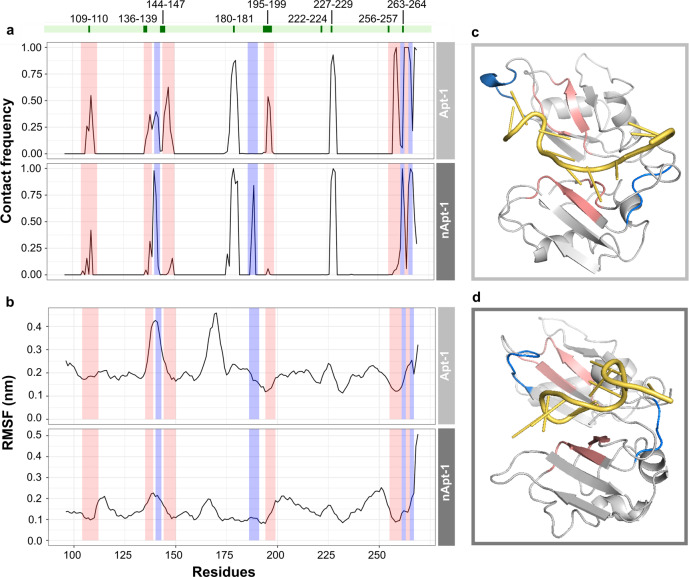
Fig. 3. MD characterization of Apt-1 and nApt-1 interactions with RRM1-2.
a Contact frequency computed along Apt-1 and nApt-1 MD trajectories; the contacts observed in the NMR model structure are marked with green boxes at the top of the image. Red is used to indicate contacts more frequent for Apt-1 and blue contacts that are more frequent for nApt-1. b Root mean square fluctuation computed along Apt-1 and nApt-1 MD trajectories. The color of the boxes follows the same as in panel (a). c Structural representation of residues with stable contacts in complex with Apt-1 (RRM1-2 representative configuration at equilibrium shown; colors correspond to panels (a) and (b). d Structural representation of residues with stable contacts in complex with Apt-1 (RRM1-2 representative configuration at equilibrium shown; colors correspond to panels (a) and (b).

