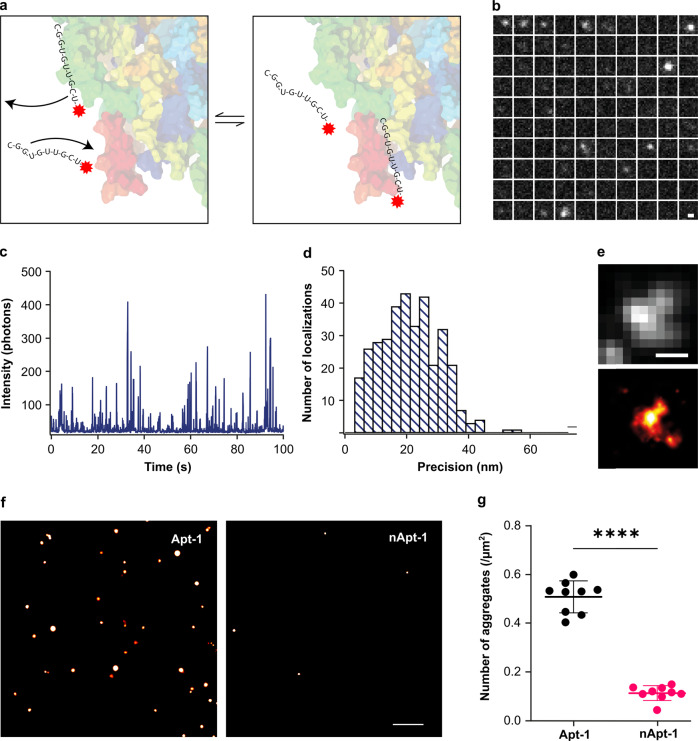
Fig. 4. SR imaging of surface-immobilized RRM1-2 aggregates.
a Schematic representation of SR imaging. The immobilized RRM1-2 aggregate is transiently bound by an Atto590-tagged Apt1 molecule, the position of which is determined with nanometer precision. This process is repeated to generate a SR image of each aggregate. b Example time montage of an oligomer being imaged using PAINT. Each sub-image is separated by 1 s, moving through time from left to right then top to bottom; scale bar: 400 nm. c Intensity profile of the oligomer imaged in (b). Individual localizations appear as bursts in intensity that are separated in space and time. d Histogram of precisions of the oligomer imaged in (b). Each localization is accurate positioned with a precision of 60 nm or less. e SR image (red hot) and diffraction-limited (gray) images of the aggregate shown in (b), scale bar is 500 nm. f Sample fields of view of clustered RRM1-2 aggregates imaged with Apt-1 and nApt-1, scale bar 1 μm. Data from 3 independent experiments. g Compared to Apt-1 nAPt-1 detects significantly less RRM1-2 aggregates. The data shown are mean ± SD of 9 fields of view. ****p = 1.9769 × 10⁻¹¹; analyzed by two-sided t-test, confidence interval 95%. Source data are provided as a Source data file64.

