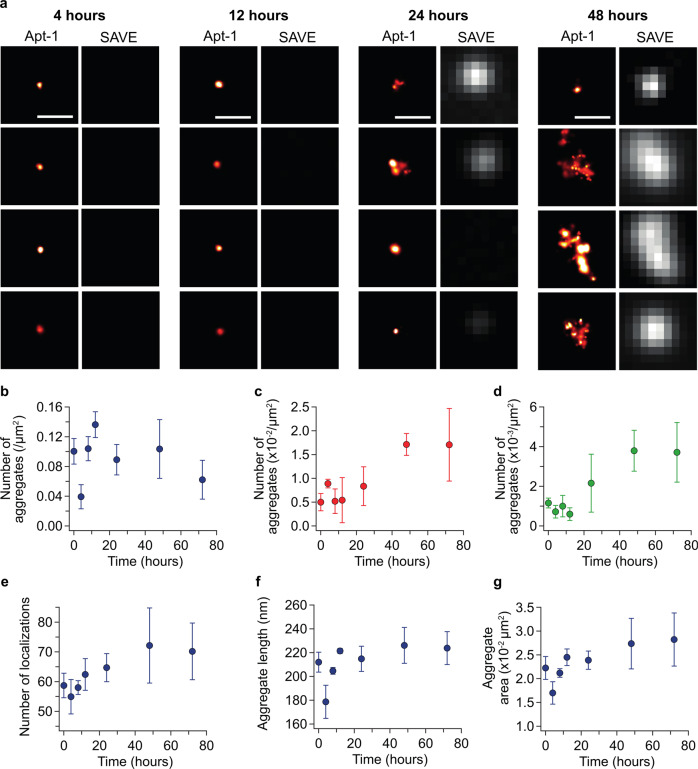
Fig. 5. Following the aggregation of RRM1-2 using Apt-1 and SAVE imaging.
a Representative Apt-1 SR images (left, red hot) and diffraction-limited SAVE images (right, gray) of RRM1-2 species over a 72 h aggregation assay, scale bar: 500 nm. b After an initial decrease in the number of aggregates detected using Apt1 from 0 to 4 h, there is a subsequent increase in their number until 48 h, after which there is a slight decrease as the aggregates get larger in size (f and g). c There is an overall increase in the number of ThT-active aggregates detected using SAVE imaging over 72 h. Approximately 10x fewer aggregates are detected using SAVE imaging compared with SR imaging using Apt1. d The number of coincident aggregates, defined as having localizations in the SR image and ThT fluorescence in the SAVE image, increases over time. At 72 h, only 6% of the aggregates detected using Apt1 are ThT-active. e The mean number of localizations per cluster increases over 72 h, as does the mean length (f) and area (g) of each aggregate analyzed using SR microscopy. Data shown are mean ± SD of three independent aggregation reactions. Source data are provided as a Source data file64.

