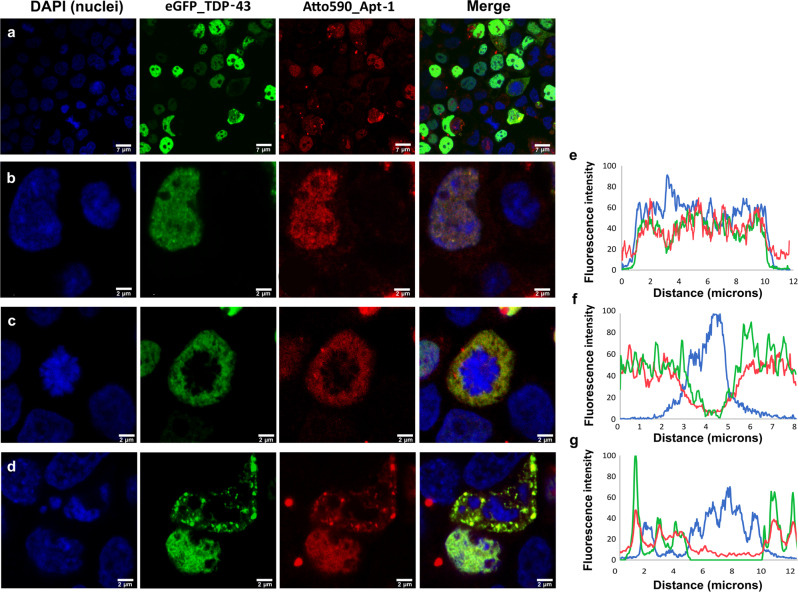
Fig. 6. Confocal microscopy analysis of TDP-43 and Apt-1 in live mammalian cells.
Blue: DAPI; green: eGFP_TDP-43; red: Apt-1_Atto590. a Wide view of Hek293T cells co-transfected with the plasmid for the overexpression of full-length TDP-43 fused to eGFP and the aptamer Apt-1 conjugated to the fluorophore Atto590. b–d Examples of isolated cells co-transfected as in (a), in which the correlation between green and red fluorescence distribution is evident. e–g Fluorescence profiles of DAPI, eGFP, and Atto590 along a diagonal line drew across the isolated correspondent cells on the left, showing corresponding distribution of the fluorescence signals of eGFP_TDP-43 and Apt-1_Atto590.

