Figure 1.
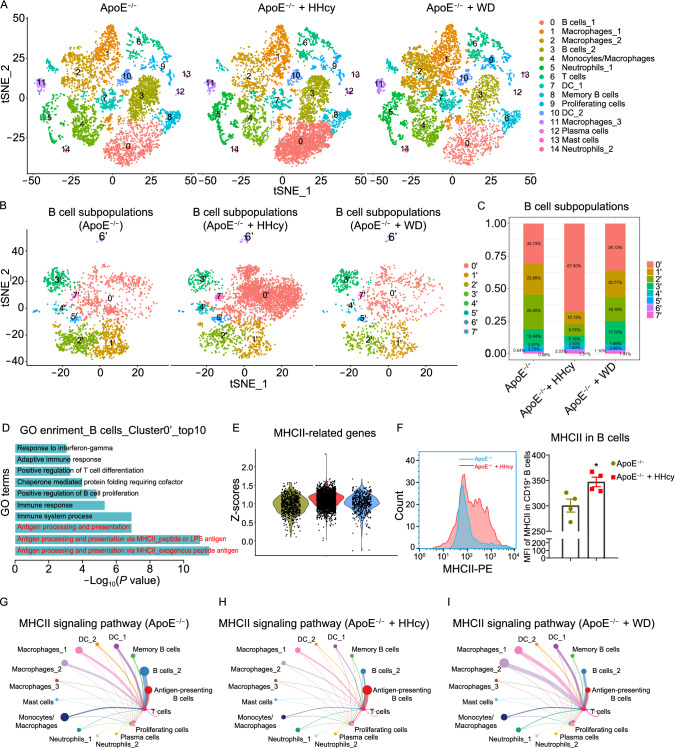
Antigen-presenting B cells play a dominant role in antigen presentation in HHcy-accelerated atherosclerosis. (A) tSNE plots showing color-coded cell clusters in the three groups. (B) tSNE plots displaying eight distinct B cell clusters. (C) Bar charts showing the percentages of B cell clusters in the three groups. (D) GO enrichment analyses of biological processes in cluster 0’. (E) Violin plots showing the scaled expression scores (Z-scores) of MHCII-related genes (H2-Aa, H2-Eb1, H2-Ab1, H2-Ob, H2-Eb2, H2-Oa, H2-DMb2, Ctss, Cd74, H2-DMa, and Ctse) across the three groups. (F) Flow cytometry analyses showing the levels of MHCII in CD19+ B cells from atherosclerotic aortas. (G–I) Circle plots showing MHCII signaling pathway in the three groups. Data represent mean ± SEM (n = 4 in (F)). * P < 0.05 by an unpaired 2-tailed t test (F).

