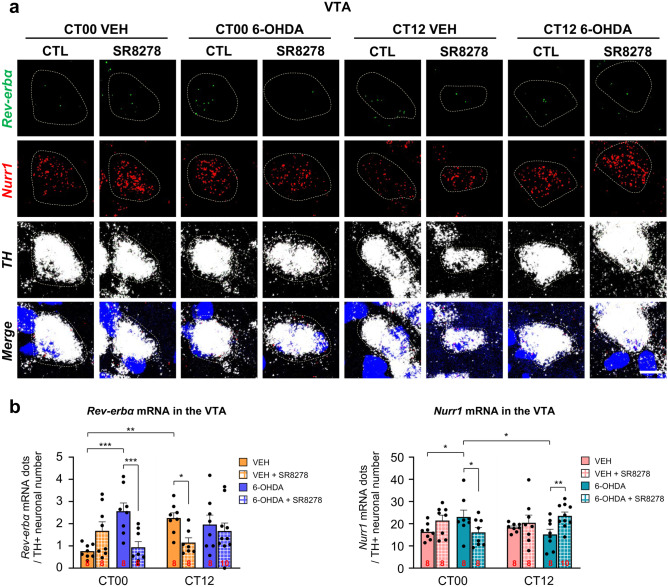
Fig. 2.
SR8278 microinjection altered transcription levels of DAergic neuron-specific Rev-erbα and Nurr1 in the VTA. (a) Representative FISH images of VTA with Rev-erbα, Nurr1, and TH staining. Scale bar = 10 µm. (b) Rev-erbα and Nurr1 mRNA expression in the VTA was represented by mRNA particles in the TH + neurons divided by the counts of TH + neurons. mRNA particles in TH + neurons were analyzed by defining the region of interest (ROI). mRNA particles were assessed in the images from two sections, covering the VTA in each animal. (Rev-erbα: two-way ANOVA, p = 0.0172 for injected group, p = 0.2354 for time, p = 0.0042 for drug-by-time interaction) (Nurr1: two-way ANOVA, p = 0.4650 for injected group, p = 0.9380 for time, p = 0.0115 for drug-by-time interaction). The data were presented as mean ± SEM. Sample sizes (brain sections) are indicated by the numbers inside bars. Fisher’s LSD post-hoc comparisons are indicated by *p < 0.05, **p < 0.01, and ***p < 0.001

