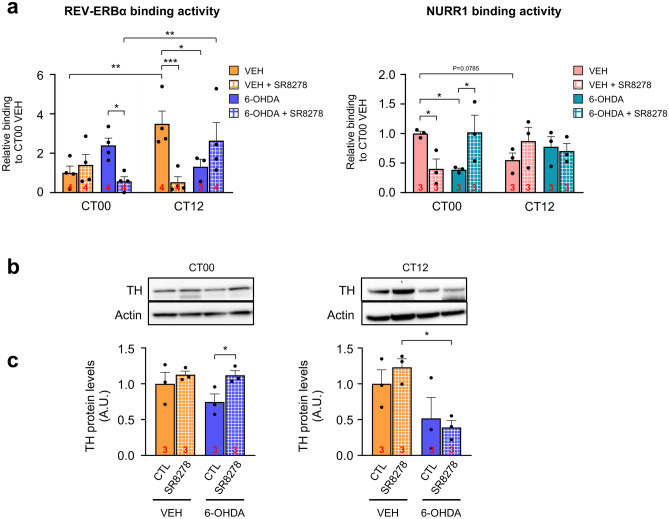
Fig. 3.
SR8278 restored binding activities of REV-ERBα and NURR1 and elevated TH expression at dawn. (a) REV-ERBα-bound TH promoter in midbrain lysates by ChIP-qPCR (left panel). NURR1-bound TH promoter in midbrain lysates by ChIP-qPCR (right panel). Chromatin prepared from midbrain tissues containing SN and VTA regions from two animals for each group. The binding activity was calculated as a percent of total chromatin used for immunoprecipitation (% input) and was normalized to VEH-treated control mice at CT00 (REV-ERBα: two-way ANOVA, p = 0.1166 for injected group, p = 0.0927 for time, p = 0.0023 for drug-by-time interaction) (NURR1: two-way ANOVA, p = 0.3594 for injected group, p = 0.8492 for time, p = 0.0284 for drug-by-time interaction). (b) Representative immunoblot images showing TH protein expression in the VTA derived from VEH- and 6-OHDA-lesioned mice at CT00 and CT12. Sample sizes (chromatin from two animals) are indicated by the numbers inside bars. (c) TH protein levels in VTA. After densitometric analysis, TH protein levels were normalized with actin levels (CT00: two-way ANOVA, p = 0.2508 for 6-OHDA-lesion, p = 0.0468 for SR8278 treatment, p = 0.2801 for interaction) (CT12: two-way ANOVA, p = 0.0088 for 6-OHDA-lesion, p = 0.7924 for SR8728 treatment, p = 0.3816 for interaction). Sample sizes (animals) are indicated by the numbers inside bars. The data were presented as mean ± SEM. Fisher’s LSD post-hoc comparisons are indicated by *p < 0.05, **p < 0.01, and ***p < 0.001

