Figure 3.
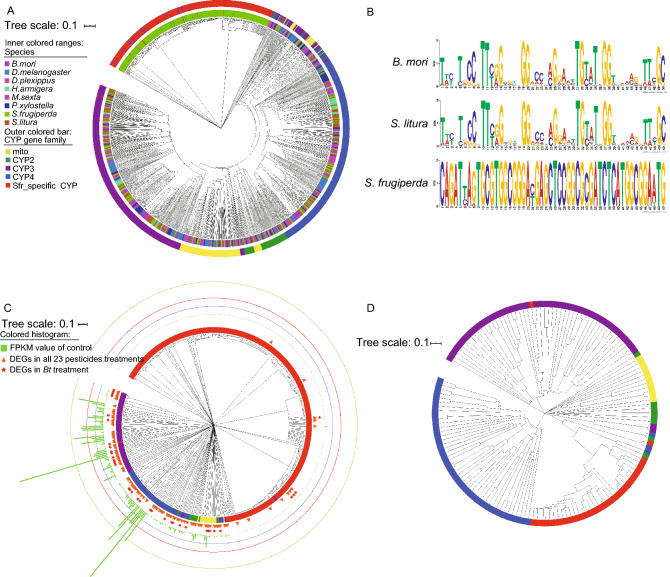
The gene tree of Cytochrome P450 gene family. (A) 1,256 Cytochrome P450 (CYP) genes in 8 species, the label color shows different species, the bar color shows different CYP gene sub-families. (B) The seq-logo plot of the motif and 10 bp flanking sequences of CYP genes in 3 species. (C) The 425 CYP genes of FAW, the bar color shows different CYP gene sub-families, 107 differential expression genes (DGEs) between all treatments and control are shown as orange triangle, 37 DGEs between Bt treatment and control are shown as red star, and the histogram means CYP gene FPKM value of control. (D) The 152 CYP genes filtered by CD-HIT, the bar color shows different CYP gene sub-families

