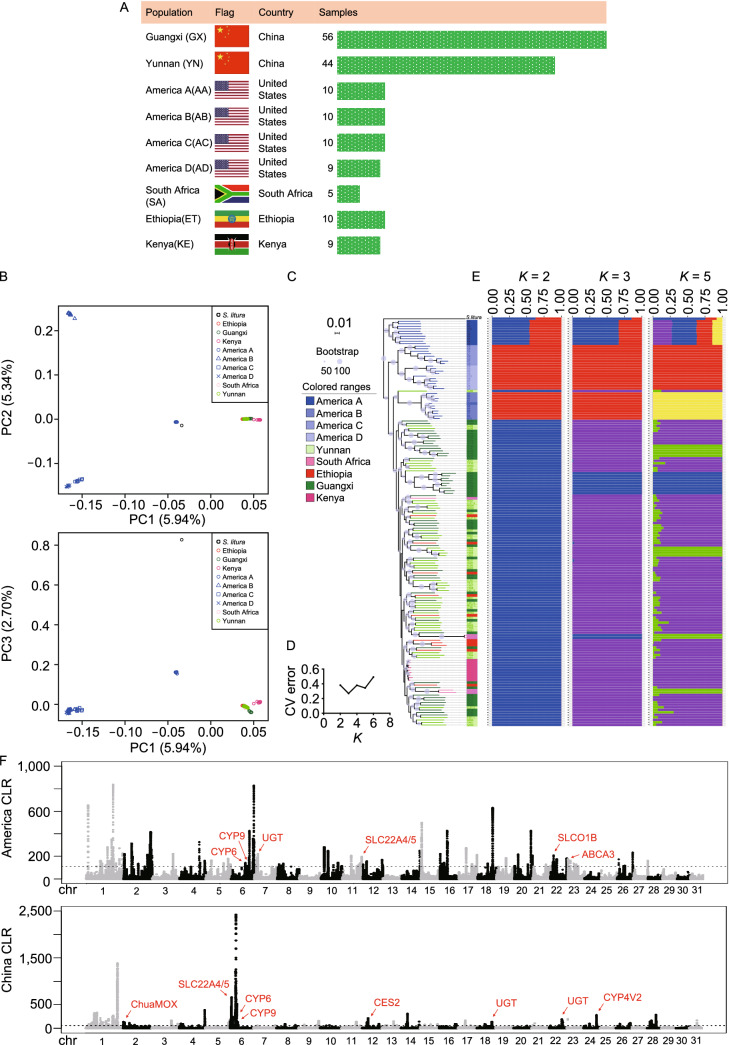
Figure 4.
Phylogeny and population structure of FAW. (A) Sampling locations of six geographical populations. (Ethiopia: red, Kenya: light red, America: blue, South Africa: pink, Guangxi: green and Yunnan: light green) (B) PCA plots of the first three components of major FAW accessions using whole-genome SNP data. (C) Maximum likelihood phylogenetic tree of FAW population (from what data). Fabricius (Spodoptera litura) was used as an outgroup. (D) Cross-validation (CV) error of ADMIXTURE. (E) Population structure of major FAW categories estimated by ADMIXTURE. Each color represents one ancestral population. Each accession is represented by a bar, and the length of each colored segment in the bar represents the proportion contributed by that ancestral population. (F) CLR scores calculated by SweeD across the genome in both American D and Yunnan accessions. The dashed lines mark the regions at the top 0.5%. The red arrow indicates the detoxification candidate gene regions

