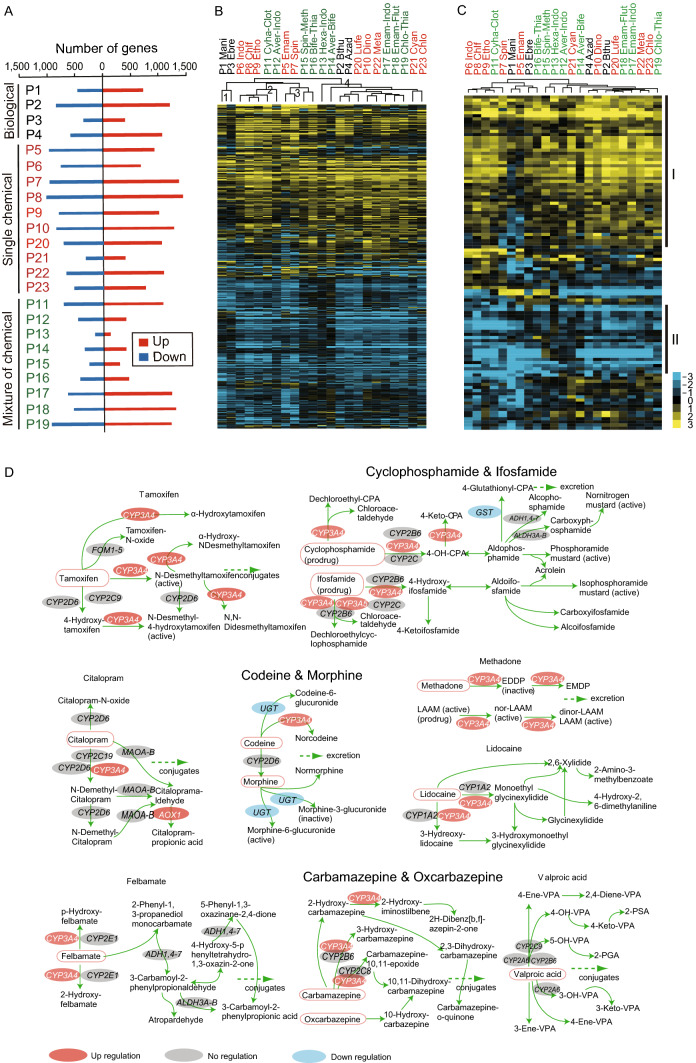
Figure 5.
Gene expression profiling after twenty-three pesticides exposure. (A) Number of differential expression genes (DEGs) after each pesticide treatment. (B) Pesticides clusters using the combined 7991 DEGs. (C) The heatmap of 107 DGEs of FAW cytochrome P450 genes. X axial shows the different treatment (P1–P23), the color shows the fold change of DGEs, yellow means up regulation, blue means down regulation, black means the gene is not DEG in one/some treatment(s). (D) DGEs of Bt involved in hsa00982 pathway. The red means up-regulated DEGs, the blue means down-regulated DEGs

