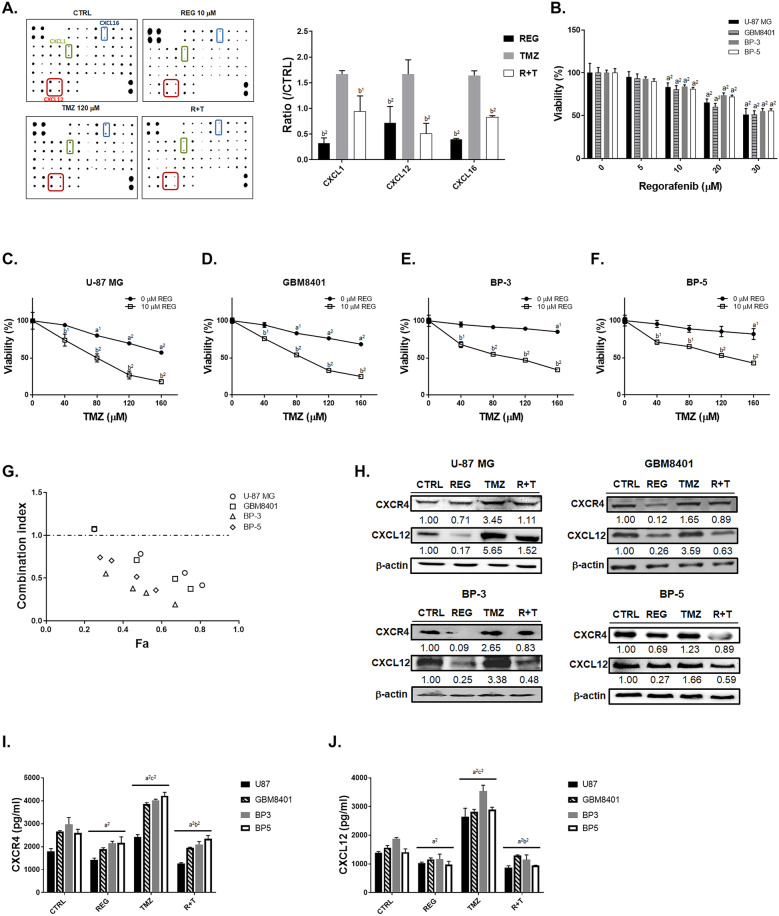
Fig. 2.
TMZ-induced expression of CXCR4/CXCL-12 was reduced by combination with regorafenib. A Chemokine protein array membrane and quantification results of CXCL-1, CXCL-12, and CXCL-16 after 10 μM regorafenib, 120 μM TMZ, and combination treatment are displayed. B The MTT viability results of regorafenib treatment in four GBM cells. The viability of C U-87 MG, D GBM-8401, E BP-3, and F BP-5 cells after regorafenib combined with TMZ are displayed. G Combination index calculated by COMPUSYN software is displayed. Symbols represent CI values derived from actual data points (Fa, fraction affected). CI = 1, additive; CI > 1, antagonistic; CI < 1, synergistic. H Western blot images of CXCL-12 and CXCR-4 in four GBM cells are displayed. Relative full blot images are presented in Supplementary Fig. 11. I–J ELISA results of CXCR4 and CXCL12 of four GBM cells are displayed. (a1 p < 0.05, a2 p < 0.01 vs. 0 μM TMZ or CTRL; b1 p < 0.05, b2 p < 0.01 vs. 120 μM TMZ or 0 μM REG). Abbreviations: CTRL, control; REG, regorafenib; R + T, regorafenib plus TMZ

