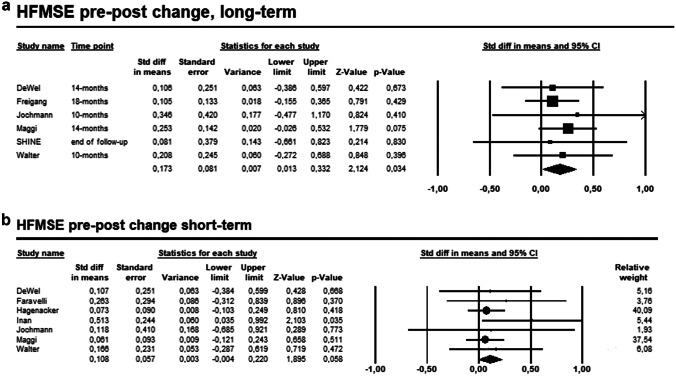
Fig. 2.
A Forest plot presenting the pooled analysis of the six studies on the comparison between pre- and post-treatment HFMSE change at the longest follow-up. B Forest plot presenting the pooled analysis of the seven studies on the comparison between pre- and post-treatment HFMSE change during short-term follow-up

