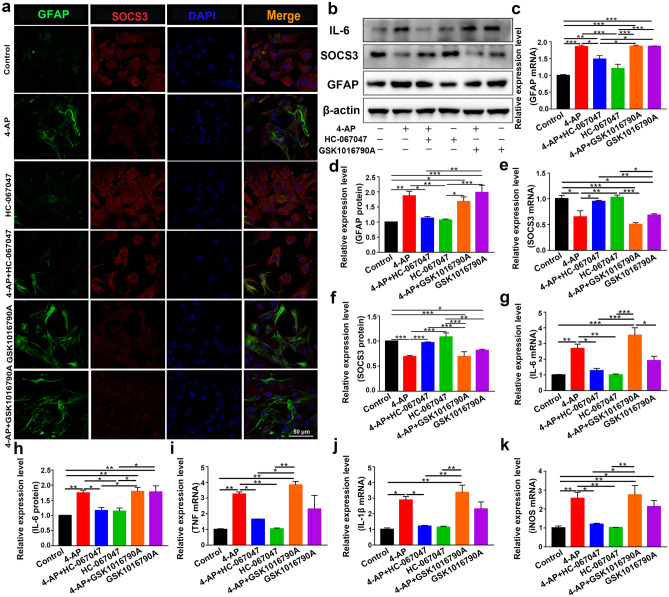
Fig. 5.
TRPV4 promoted astrocyte activation, the production, and the release of proinflammatory cytokines in 4-AP-induced astrocytes. a Representative confocal imaging showing GFAP (green) and SOCS3 (red) expression in primary cultured astrocytes after treatment for 24 h with 4-AP, the TRPV4 antagonist HC-067047 (10 μM), or the TRPV4 agonist GSK1016790A (200 nM) (n = 3). b Representative immunoblots showing the protein expression of GFAP, SOCS3, and IL-6 in primary cultured astrocytes after the different treatments (n = 3). c–d Quantitative analysis of the mRNA (c) and protein (d) levels of GFAP (n = 3). e–f Quantitative analysis of the mRNA (e) and protein (f) levels of SOCS3 (n = 3). g, h Quantitative analysis of the mRNA (g) and protein (h) levels of IL-6 (n = 3). i–k The mRNA levels of TNF-α (i), IL-1β (j), and iNOS (k) (n = 3). The data are presented as means ± SEM, *P < 0.05, **P < 0.01, ***P < 0.001, Tukey’s test after ANOVA

