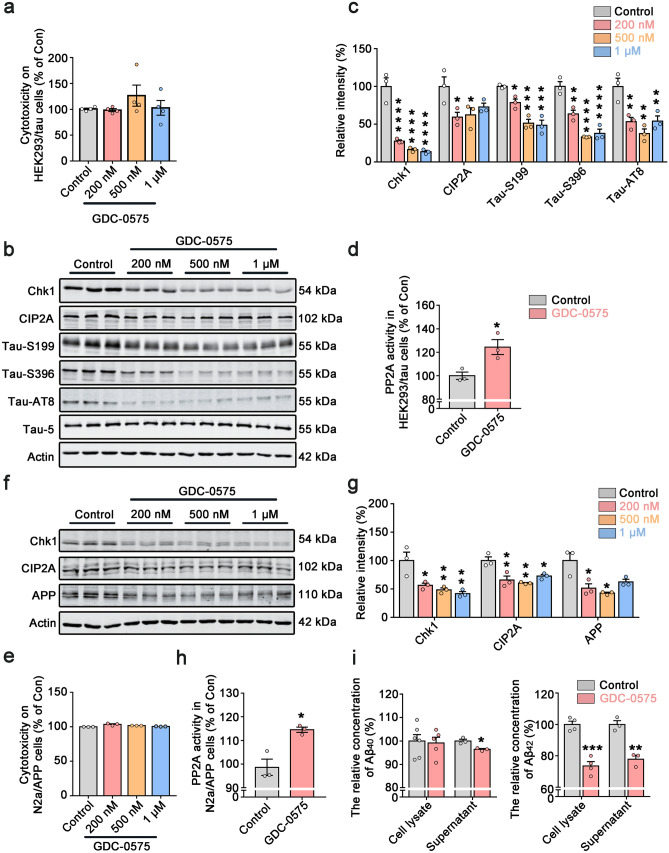
Fig. 5.
Chk1 inhibitor (GDC-0575) reduces CIP2A expression, activates PP2A, decreases tau phosphorylation and Aβ levels in AD cell models. a Cell viability was detected in HEK293/tau cells by LDH cytotoxicity assay kit. b Representative immunoblots of Chk1, CIP2A, Tau-S199, Tau-S396, Tau-AT8, Tau-5, and β-actin in HEK293/tau cells treated with increasing doses of GDC-0575 (0, 0.2, 0.5, 1 μM) for 24 h. Blots were from different gels with the same batch of samples electrophoresed. c The quantitative analysis of the protein levels in b. Non-phosphorylated proteins such as Chk1, CIP2A, and APP were normalized to the β-actin levels; phosphorylated Tau-S199, -S396, and -AT8 were normalized to total tau (Tau-5) levels. d PP2A activity was detected in HEK293/tau cells. e Cell viability was detected in N2a/APP cells by LDH cytotoxicity assay kit. f Representative immunoblots of Chk1, CIP2A, APP, and β-actin in N2a/APP cells treated with increasing doses of GDC-0575 (0, 0.2, 0.5, 1 μM) for 24 h. g The quantitative analysis of the protein levels in f. h PP2A activity was detected in N2a/APP cells. i The relative concentration of Aβ40 in cell lysate and supernatant (left) and Aβ42 in cell lysate and supernatant (right) of N2a/APP cells treated with 0.5 µM GDC-0575 treatment for 24 h. All data represent mean ± SEM, a–h n = 3, i the relative concentration of Aβ40 and Aβ42 in the cell lysate of the control group, n = 6, n = 4 respectively, and in the GDC group, n = 5, n = 4 respectively. i The relative concentration of Aβ40 and Aβ42 in supernatant of control group and GDC-0575 group n = 3, *P < 0.05, **P < 0.01, ***P < 0.001, ****P < 0.0001, compared to controls

