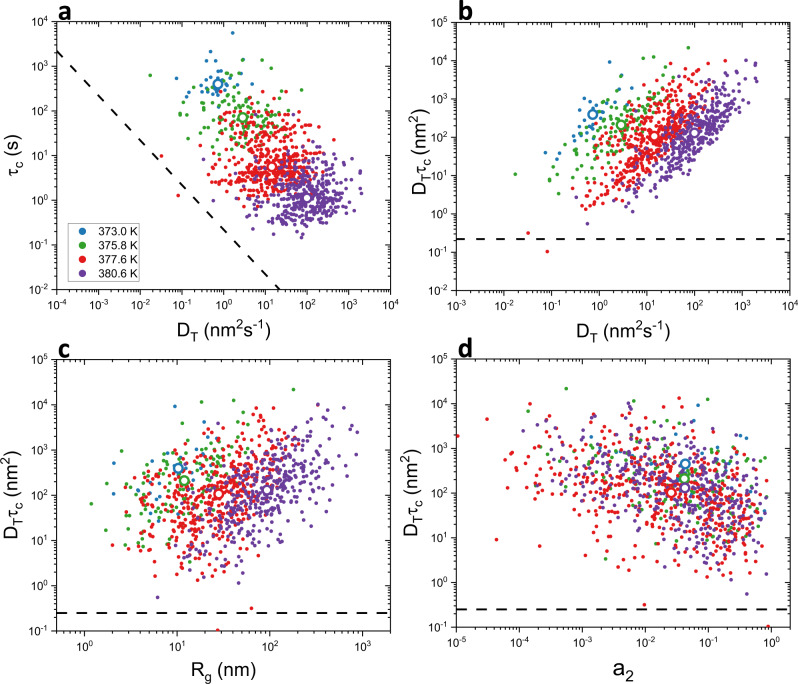
Fig. 2. Scatter plots of rotational and translational data obtained from single molecule trajectories.
Each point represents a single molecule. Large open points show median single molecule values. Black dashed lines in all panels represent DTτc = 0.25 nm2, the expected value in the absence of DSE breakdown. a Rotational correlation time (τc) vs. translational diffusion coefficient (DT). b Value of DTτc vs. DT. Strong correlation between degree of breakdown as captured by deviation of the value of DTτc from that expected (black dashed line) and DT suggests breakdown is primarily driven by translation. c Radius of gyration (Rg) vs. the value of DTτc shows molecules that explore larger areas tend to exhibit higher degree of breakdown. d Asymmetry coefficient (a2) vs. the value of DTτc, with a2 = 1 indicating an isotropic trajectory and smaller values indicating increasingly directional trajectories. Molecules with anisotropic trajectories tend to exhibit more breakdown. In all panels, color coding for temperature is as shown in the legend of (a).

