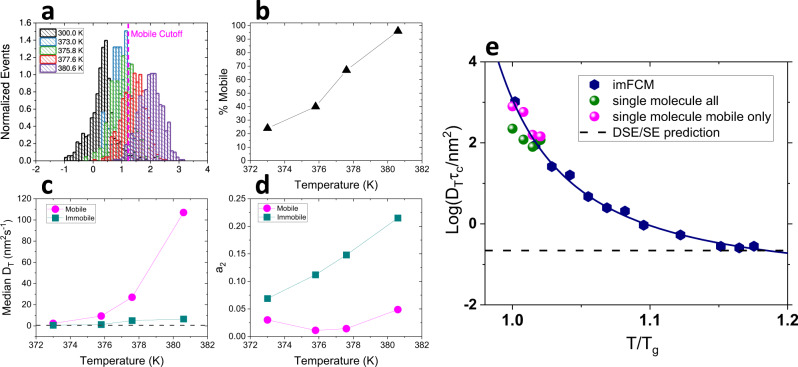
Fig. 3. Analysis of mobile and immobile single molecule trajectories.
(a) Distributions of time-normalized radii of gyration. Mobile cutoff was determined to be 16.9 nm, as indicated by the pink dashed line. (b) Percentage of molecules identified as mobile increases as a function of temperature. (c) Median diffusion coefficients for mobile and immobile molecules as a function of temperature. Dashed line indicates median DT from 300.0 K baseline data with only positive diffusion coefficients included. (d) Median asymmetry coefficient (a2) as a function of temperature for molecules identified as mobile and immobile. Values closer to 0 indicate more anisotropic trajectories. (e) Degree of DSE breakdown vs. temperature as obtained from imFCM (navy symbols) and median single molecule results for all (green) and mobile (pink) molecules. Navy line is a polynomial fit to the imFCM data. Black dashed line indicates DSE behavior.

