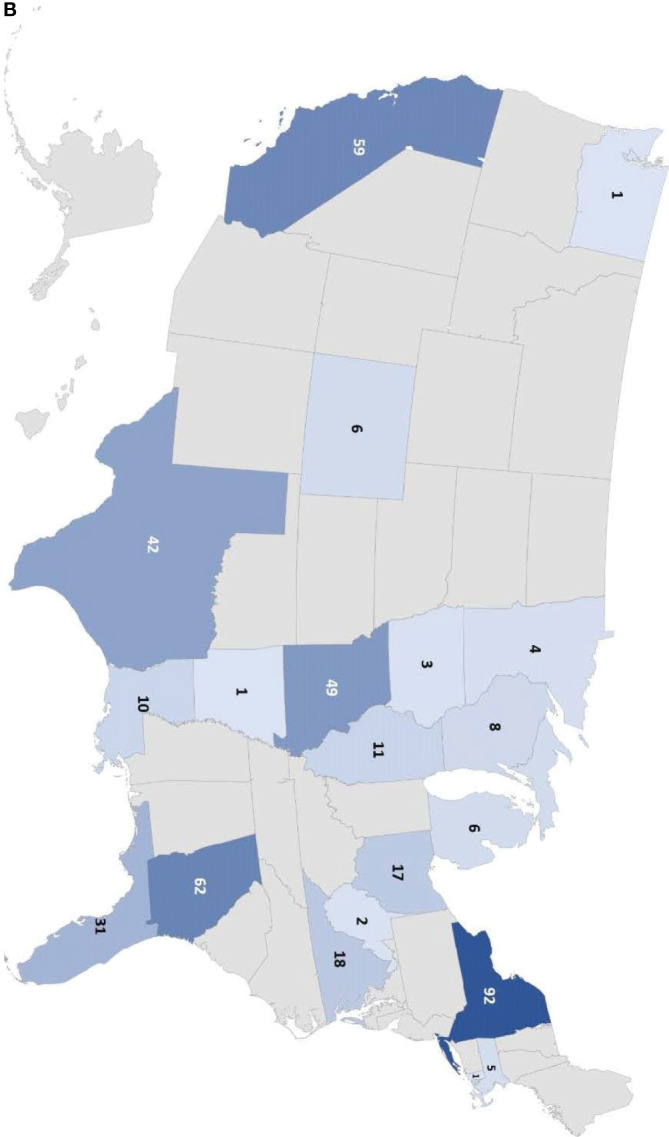
Figure 1.

Number of individuals tested in the Jeffrey’s Insights program based on geographic region. (A) Number of individuals tested globally by country in the program. The numbers indicate the number of individuals tested from each country. Countries are colored from light to dark to correspond to the relative number of individuals tested from low to high, respectively. (B) Number of individuals tested in the U.S. by state. The numbers indicate the number of individuals tested from each state. The color scale represents the relative number of individuals tested in each state with the light blue corresponding to a few individuals tested to dark blue indicating the states with the highest numbers of individuals tested.
