Figure 1.

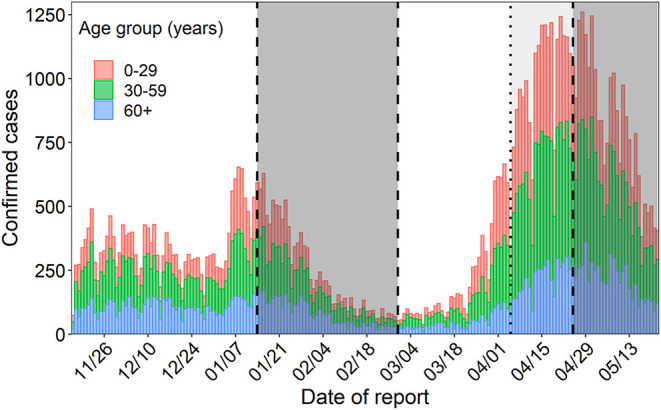
Incidence over time in Osaka. The colors of the bars represent age group. The gray shaded area signifies the state of emergency period and the area shaded in light gray represents the pre-emergency measures period.

Incidence over time in Osaka. The colors of the bars represent age group. The gray shaded area signifies the state of emergency period and the area shaded in light gray represents the pre-emergency measures period.