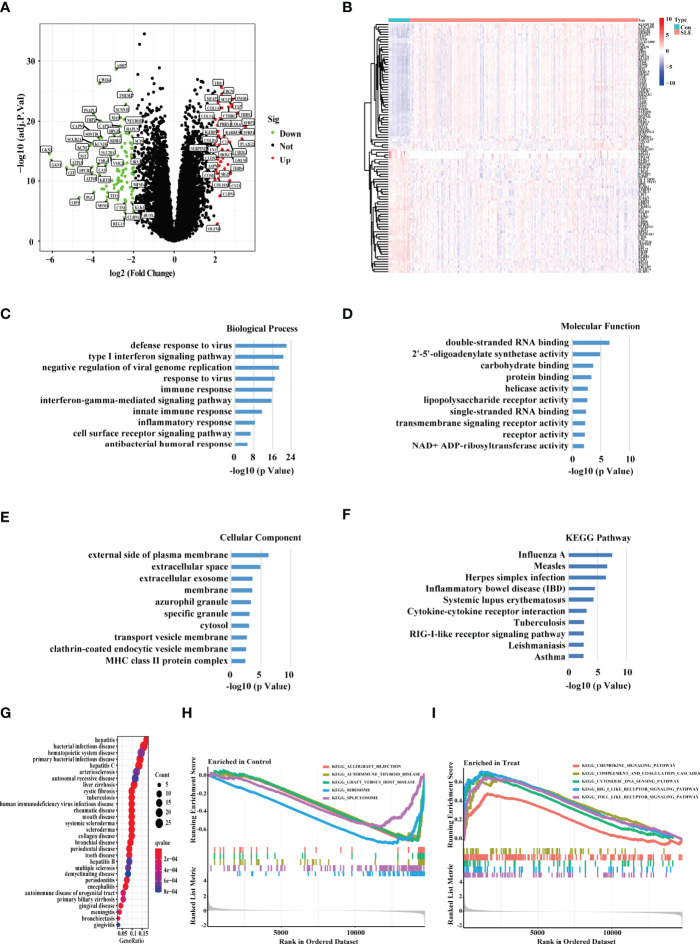
Figure 1.
Screening the DEGs between the SLE PBMC versus Control PBMC. (A) Volcano plot showing the DEGs between the PBMC of SLE and control samples based on the metadata set including GSE65391, GSE121239, and GSE61635. Green represented down-regulation, and red represented up-regulation (SLE/Control). (B) The heat map showing the DEGs in each sample of SLE patients and healthy people. “Con” represented control samples, and “SLE” represented SLE patients. (C–E) The GO, (F) KEGG, and (G) DO enrichment analysis of the DEGs. The size of the dots represented the number of genes in each enriched module. The color of the dots represented the q value. (H–I) The GSEA analysis revealing the enriched pathways in the PBMC of SLE and control samples.

