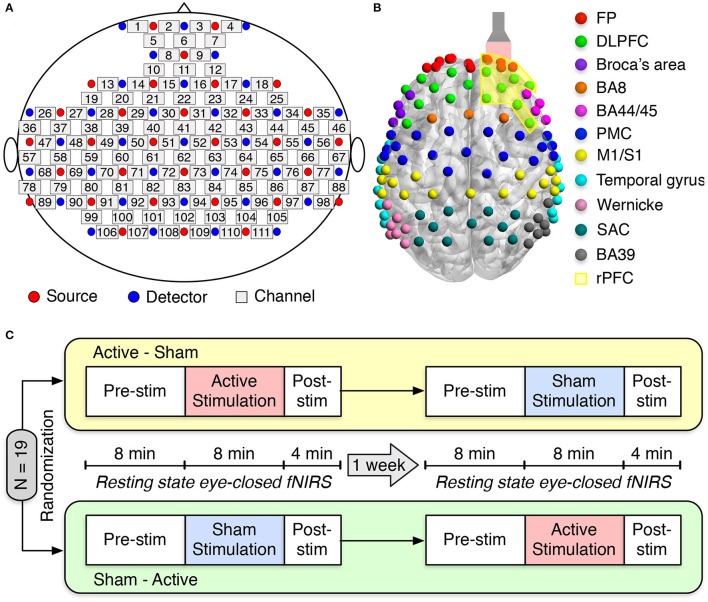
Figure 1.
Experimental setup and protocol. (A) fNIRS source-detector configuration. The source and detector optodes are denoted as the red and blue circles, whereas squares represent the functional channels. (B) The distribution of 111 functional channels over different brain cortices: frontopolar area (FP) (red), dorsolateral prefrontal cortex (DLPFC) (green), Broca's area (purple), BA8 (orange), BA44/45 (pink), premotor cortex (PMC) (blue), primary motor and somatosensory cortices (M1/S1) (yellow), temporal gyrus (cyan), Wernicke's area (olive), somatosensory association cortex (SAC) (teal), and BA39 (gray). The flashlight represents the laser beam delivered to the right forehead of the subject. The yellow-shaded area corresponds to the right prefrontal cortex (rPFC). (C) Schematic diagram of the experimental protocol. Nineteen subjects were randomly divided into two groups: active-sham or sham-active stimulation. A minimum 1-week waiting period between two visits was required to avoid potential effects from active tPBM.

