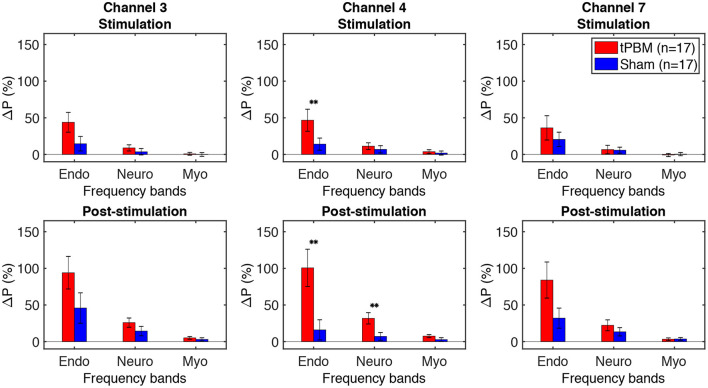
Figure 5.
Percentage changes of Δ[HbO] power ΔP of three significant channels (3, 4, and 7) for the tPBM/sham stimulation (first row) and post-stimulation (second row) periods. tPBM- and sham-induced ΔP are marked by red and blue bars, respectively. Error bars indicate the standard error of the mean of each group. Statistical results obtained by paired t-tests between tPBM and sham sessions are marked as “**” for p < 0.01.

