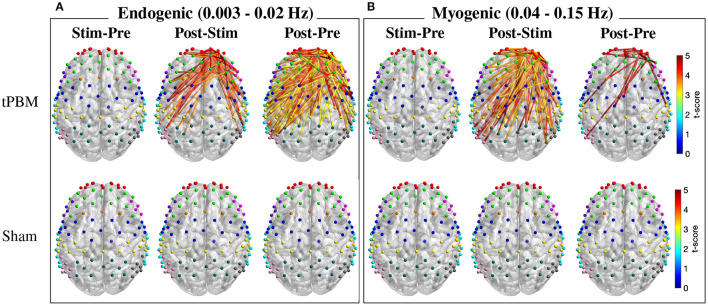
Figure 6.
T-score maps of significant changes in FC between three pairs of periods for two frequency bands: (A) endogenic and (B) myogenic (p < 0.05, FDR corrected). Only FC from right PFC to all channels was considered for the statistical analysis. The FC strength was compared between stimulation vs. pre-stimulation (Stim-Pre), post- vs. during stimulation (Post-Stim), and post- vs. pre-stimulation (Post-Pre) for both active (first row) and sham (second row) tPBM.

