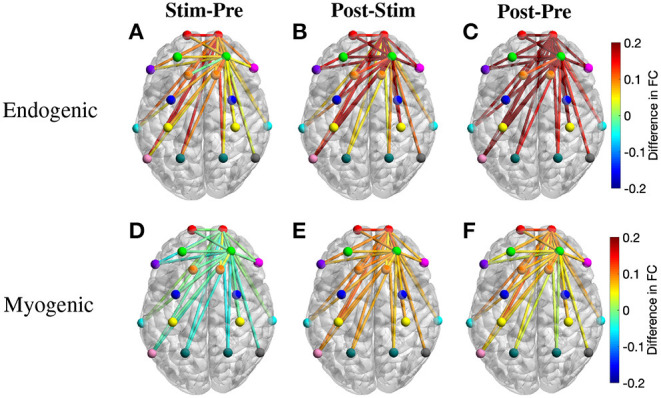
Figure 7.

Topographical maps of the region-wise difference in FC between three pairs of periods for two frequency bands: (A–C) endogenic and (D–F) myogenic. ROIs include left and right frontopolar area (lFP; rFP) (red), left and right dorsolateral prefrontal cortex (lDLPFC; rDLPFC) (green), Broca's area (purple), left and right BA8 (lBA8; rBA8) (orange), BA44/45 (pink), left and right premotor cortex (lPMC; rPMC) (blue), left and right primary motor and somatosensory cortices (lM1/S1; rM1/S1) (yellow), left and right temporal gyrus (lTemporal; rTemporal) (cyan), Wernicke's area (olive), left and right somatosensory association cortex (lSAC; rSAC) (teal), and BA39 (gray). Only FC from (lFP; rFP) and (lDLPFC; rDLPFC) to all ROIs was plotted.
