Figure 2.
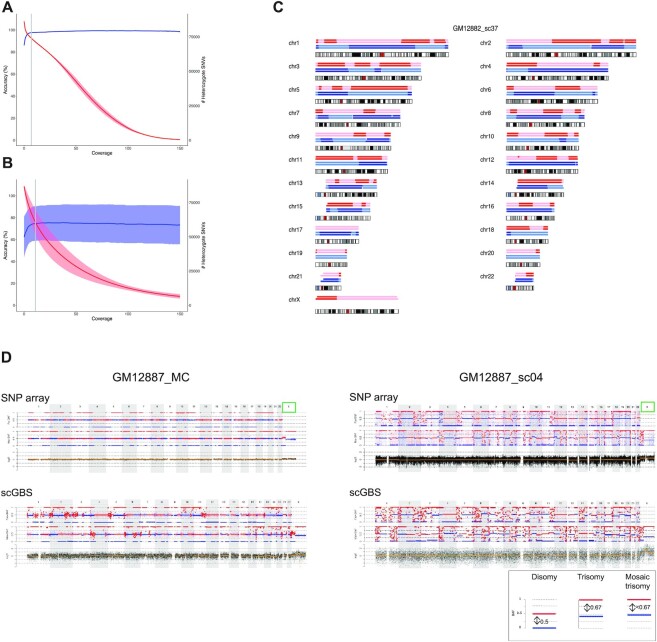
scGBS haplotyping and copy-number profiling on HapMap cell lines. (A) Genotypes from joint genotyping individuals GM12877 (father) and GM12878 (mother) were compared to heterozygote SNV calls from the Platinum Genomes (Illumina Inc., USA) and both accuracy (blue line = mean ± standard deviation) and the total number (red line = mean ± standard deviation) of the genotypes were evaluated against the minimum coverage of the genotype calls in order to select a coverage threshold. The gray line represents the coverage of 7×, which was applied as a threshold to bulk samples in subsequent analyses. (B) Genotypes from single cells of siblings GM12882 and GM12887 were compared to heterozygote SNV calls from its respective bulk sample with a threshold applied of 7× coverage. The accuracy (blue line = mean ± standard deviation) and the total number (red line = mean ± standard deviation) of the calls were evaluated against the minimum coverage of the genotype calls. The gray line represents the coverage of 11×, which was applied as a threshold to single-cell samples in subsequent analyses. (C) For each chromosome an ideogram together with the haplotype blocks after SNP array (top) and scGBS (bottom) is shown. Dark and light blue represent paternal haplotyping, whereas red and light red represent maternal haplotyping. Transition from dark to light color or vice versa represents an homologous recombination site. Genome-wide haplotype block comparison of scGBS- and SNP-array-based haplotyping results for a single blastomere biopsy sample from GM12882 from the HapMap pedigree (GM12882_sc37) are shown. Phasing occurred via sibling GM12887, which results in the availability of both maternal and paternal haplotypes. (D) An example of the genome-wide comparison between scGBS- and SNP-array-based copy-number profiling is shown for two samples from the HapMap pedigree; one bulk (GM12887_MC) and one single-cell (GM12887_sc04). Both genome-wide maternal and paternal haplarithm (Mat-BAF and Pat-BAF tracks) plots together with a copy-number values (logR track) plot for chromosome 1 to X are displayed. Haplarithm plots serve as the visualization of the haplotyping process by haplarithmisis (Supplementary Figure S1). Haplotyping was performed with a sibling (GM12882) and thus, both maternal and paternal haplarithm can be displayed. For the first sample (GM12887_MC), interpretation of the logR profile identified a mosaic paternal trisomy for chromosome X (green box), which was not reported in the karyotype of the cell line. In the single-cell sample, GM12887_sc04, the pure trisomy for chromosome X is present. Copy-number analysis with a combination of haplarithm and logR profiles allows to specify parental origin for the aberrations. In case of disomic chromosomes, red and blue lines for maternal and/or paternal haplarithms are spaced with a distance of 0.5 apart (see legend bottom right). The pure paternal trisomy X in the single cell is indicated indirectly by the increased distance (= 0.67) between the maternal red and blue lines, which represents a lower fraction of maternal compared to paternal chromosomes. Here, the presence of a paternal trisomy for chromosome X in a mosaic state is indicated by a distance of <0.67 between the red and blue lines of the maternal haplarithm. These findings show concordant between scGBS and SNP array.

