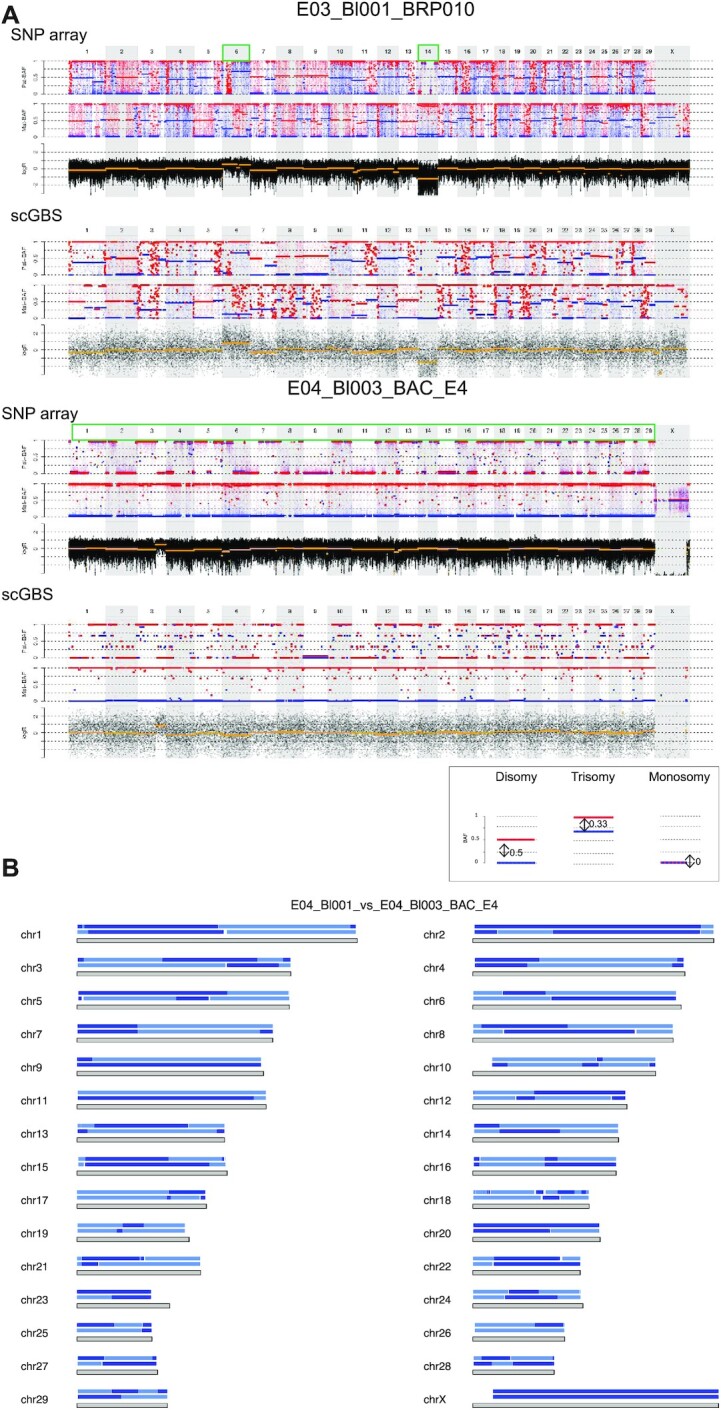
Figure 6.

scGBS applied to bovine single blastomeres. Examples of haplotyping and copy-number profiling results from bovine single blastomeres are shown. (A) For each chromosome the length is characterized by a grey block with the haplotype blocks of E04_Bl001 (top) and E04_Bl003 (bottom) from family BAC_E4 is shown. Dark and light blue represent paternal haplotyping. Transition from dark to light color or vice versa represents an homologous recombination site. Genome-wide paternal haplotype block comparison of the two single blastomeres from the same embryo reveals multiple different homologous recombination sites indicating two differential paternal genomes present in the same embryo. (B) Genome-wide comparison between scGBS- and SNP array-based haplotype and copy-number profiling is shown for two bovine embryo biopsies from two families. The genome-wide maternal and paternal haplarithm (Mat-BAF and Pat-BAF, respectively) tracks together with a copy-number values (logR) track are displayed. In both families haplotyping was performed with a sibling embryo, which results in the display of both maternal and paternal haplarithm. A legend is present below the figure to highlight a disomic profile and the specific haplarithm profile for the parent-specific aberration. In case of disomic chromosomes, red and blue lines for maternal and/or paternal haplarithms are spaced with a distance of 0.5 apart. In E03_Bl001_BRP010, comprehensive analysis by using haplotyping and copy-number profiling results in the detection two single aneuploidies, i.e. a paternal trisomy of chromosome 6 (distance Pat-BAF = 0.33 and Mat-BAF = 0.67) and a paternal monosomy for chromosome 14 (distance Pat-BAF = 0 and Mat-BAF = 1). In a second example, a single blastomere from a separate embryo, E04_Bl003_BAC_E4, combined analysis of haplotyping and logR results in the identification of only paternal chromosomes genome-wide, with a segmental gain for chromosome 3. Analysis of logR profile alone would have resulted in the interpretation of a segmental trisomy for chromosome 3. However, the distance of the red and blue lines on the Pat-BAF profile is 0 (Pat-BAF) and 1 for the Mat-BAF profile reveals the more complex genomic constitution of the single blastomere.
