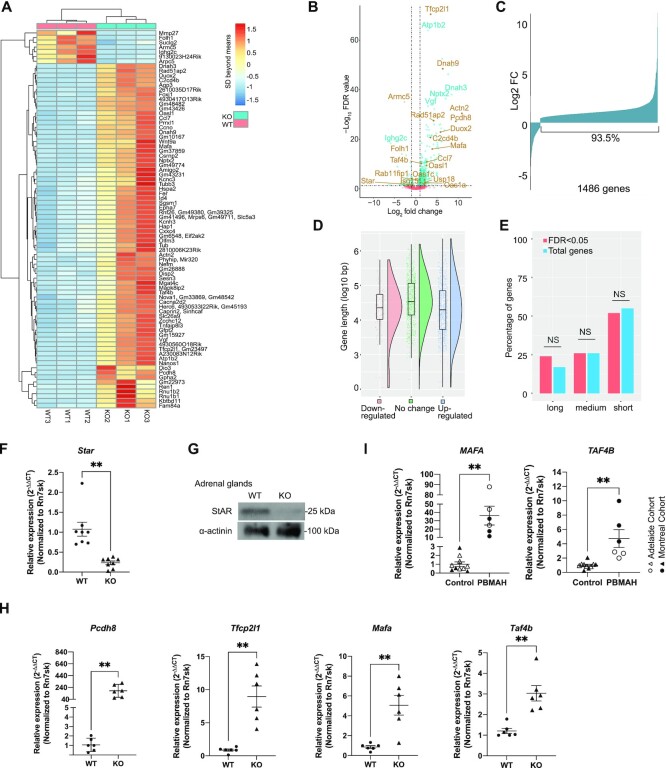
Figure 5.
RNA-seq of WT and KO adrenal glands. (A) A heatmap of differentially expressed genes. Eighty genes with the lowest FDR were shown. For a given gene, color represents SDs beyond the mean of raw reads in all the six samples (3 KO and 3 WT) tested. (B) A volcano plot of FDR and expression fold changes (FC) of all the genes detected in the KO versus WT adrenal glands according to RNA-seq. Some prominently changed ones are annotated, and dysregulation of genes indicated in brown was confirmed by RT-qPCR. Dashed horizontal and vertical lines represent FDR = 0.05 and log2FC = ±1, respectively. (C) Fold changes of expression for 1486 genes with FDR < 0.05 in the KO versus WT adrenal glands. (D) The length distribution of the genes with significant upregulation or downregulation or without change. The box graphs show the median (solid horizontal line in the box), the 75th percentile (upper part of the box), 25th percentile (lower part of the box), 95th percentile (upper whisker), 5th percentile (lower whisker), and outliers (dots beyond the 95th and 5th percentile) of the gene length of each group. The violin plots illustrate the gene size distribution of each group. (E) The length of the upregulated genes was similar to those in the whole genome. The percentages of short (<30 kb), medium (≥30 kb and <100 kb), and long (≥100 kb) genes of the significantly upregulated genes (FDR < 0.05) and the percentages of genes of these sizes in all the genes in the genome are shown. No significant difference was observed in any length category (P > 0.05; χ2 test). (F) Reduced Star mRNA levels in the KO adrenal glands according to RT-qPCR. (G) Reduced STAR protein levels in the KO adrenal glands according to immunoblotting. A representative blot from three replicates is shown. (H) Elevated mRNA levels of tumor suppressor genes (Pcdh8 and Tfcp2l1) and oncogenes (Mafa and Taf4b) in the mouse KO adrenal glands, according to RT-qPCR. (I). Elevated mRNA levels of oncogenes MAFA and TAF4B in the human PBMAH adrenal gland samples according to RT-qPCR. Genes in (H) and (I) were selected from the ones with significant upregulation in the mouse KO adrenal glands according to RNA-seq. The signal ratios of the test genes versus Rn7sk were presented. Means ± SEM are shown. **P < 0.01; ***P < 0.001 (paired two-way Student's t-tests for mouse samples and unpaired two-way Student's t-test for human samples).

