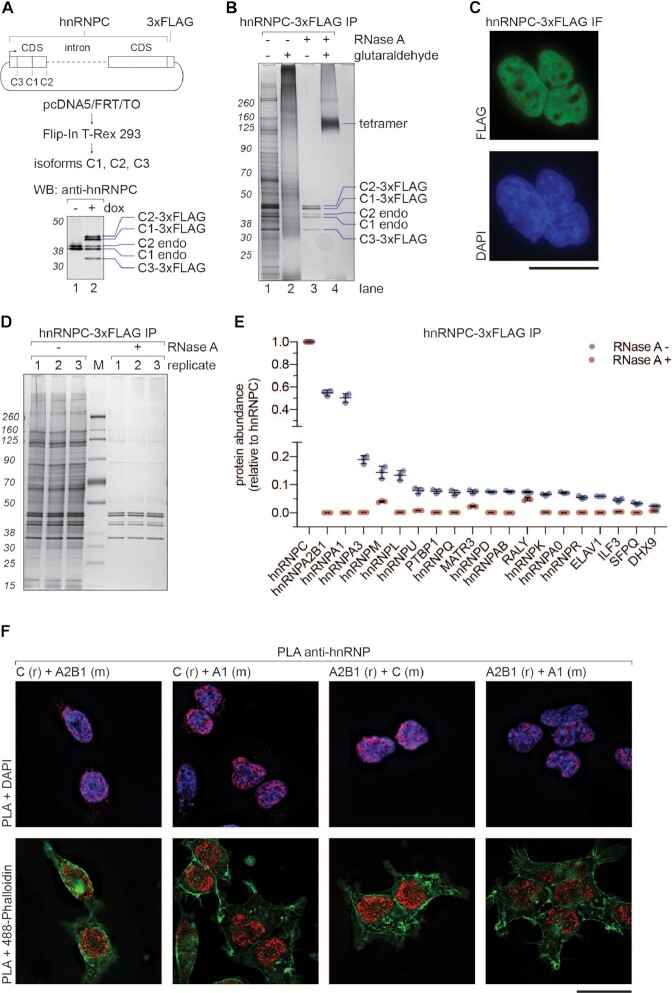
Figure 1.
HnRNP C tetramer associates with A-group hnRNPs. (A) Upper panel: schematic representation of the construct used for doxycycline-inducible expression of hnRNP C-3xFLAG in HEK293 Flip-In T-Rex cells. Lower panel: Western blot analysis of the whole cell extract from cells expressing hnRNP C-3xFLAG. (B) SDS-PAGE/silver staining analysis of hnRNP C-3xFLAG IPs. Samples were treated with RNase A before elution (lanes 3 and 4). Glutaraldehyde crosslinking (final 0.2%) was applied after native elution (3xFLAG peptide) to probe for higher order assemblies (lanes 2 and 4). (C) Immunofluorescence analysis of hnRNP C-3xFLAG using anti-FLAG and Alexa Fluor 488 antibodies. DAPI stain was used as a nuclear marker. Scale bar represents 25 μm. (D) SDS-PAGE/silver staining analysis of eluates from hnRNP C-3xFLAG IPs performed in triplicate with (+) and without (−) RNase A treatment. (E) MS analysis of samples from (D). Column chart displaying abundance of selected proteins (top 20 hits) from hnRNP C-3xFLAG eluates. Y axis shows relative abundance values normalized to the bait protein. Note disruption of the axis to reveal intensities of plotted factors. Error bars represent standard deviation triplicates. (F) Proximity ligation assay. Capital letters represent used anti-hnRNP antibodies, whereas (r), or (m) animals they were raised in (r for rabbit and m for mouse). DAPI and 488-Phalloidin were included as nuclear and cytoplasmic markers, respectively. Scale bar represents 25 μm.

