Figure 2.
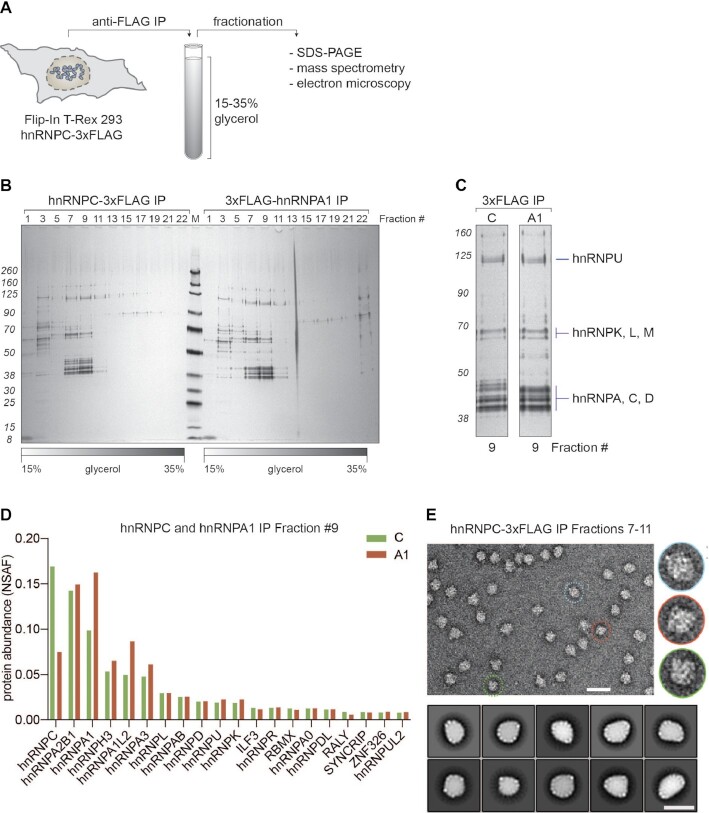
Biochemical characterization of 40S hnRNP particles. (A) Schematic representation of the workflow established to purify 40S hnRNP particles from cells expressing hnRNP C-3xFLAG (or other hnRNP particle components). Native eluates are fractionated on a glycerol gradient. Collected fractions are analyzed using SDS-PAGE, mass spectrometry, or electron microscopy. (B) SDS-PAGE/silver staining analysis of 15–35% glycerol gradient fractions from hnRNP C-3xFLAG (left) and 3xFLAG-hnRNP A1 (right) purifications. Every other fraction was loaded (odd numbers). (C) Fractions 9 with labeled protein bands from gradient analysis displayed in (B). (D) MS analysis of fractions 9 from gradients displayed in B. Plotted are top 20 the most abundant proteins from both purifications (hnRNP C-3xFLAG in green, 3xFLAG-hnRNP A1 in red), sorted based on their NSAF (normalized spectral abundance factor) protein abundance values. (E) Negative stain EM analysis of endogenous 40S hnRNP particles. A representative electron micrograph (scale bar: 50 nm) and magnified views of individual particles (right, inset) are shown. Lower panel: 2D classification of endogenous 40S hnRNP particles. Class averages are sorted by occupancy, top 10 classes of 25 are shown (scale bar: 25 nm).

