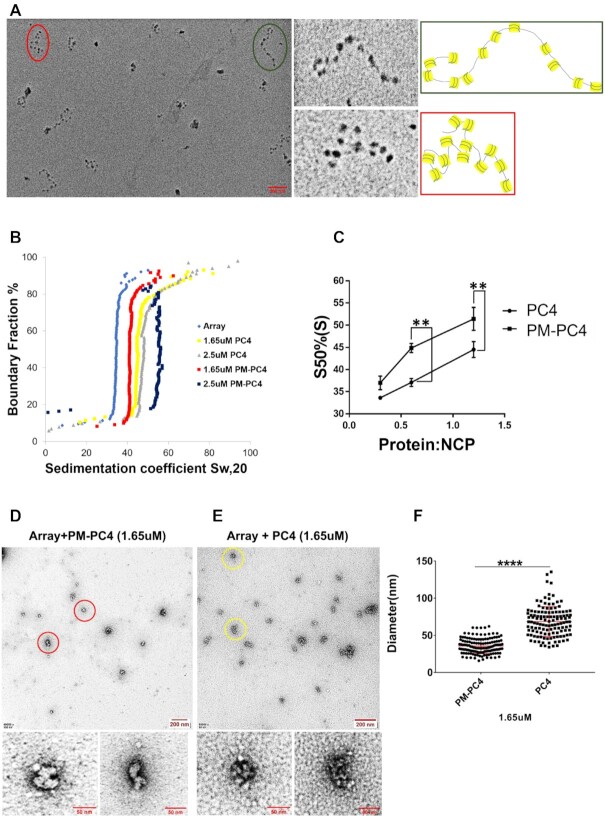
Figure 3.
Phosphomimic PC4 promotes condensation of an in vitro reconstituted nucleosomal array. (A) EM image of nucleosomal arrays after metal shadowing. Two dodecameric arrays, marked in green and red circles within the overview EM image, shown in a close up view alongside. The models of representative 12 × 177 oligonucleosomes of the two indicated arrays with green and red borders shown alongside. (B) Sedimentation velocity analysis by analytical ultracentrifugation of PM-PC4 (phosphomimc PC4) and PC4 (wild type unmodified recombinant) incubated chromatin arrays. A nucleosome array without any ectopic addition of protein was used as a control. (C) Sedimentation coefficient values from panel C represented for the nucleosome core particle (NCP) containing increasing concentrations of PM-PC4 and PC4 at a 50% boundary fraction (n = 3). Data represent the means ± SEM. The S50%(S) were statistically analysed by Student's paired t-test (*P< 0.05,**P< 0.01,***P< 0.001, ns-non-significant). (D, E) EM images of PM-PC4 (phosphomimc PC4) and PC4 (wild type unmodified recombinant) incubated nucleosome array respectively. Two condensed arrays from each of the respective overview EM images have been encircled in red (for PM-PC4 bound array) and yellow (for PC4 bound array) circles and their close up view has been shown below. (F) Distribution of diameters (in nm) of PM-PC4 and PC4 bound compacted array particles. No. of particles measured = 142. Data represent the means ± SD. The S50%(S) were statistically analysed by Student's unpaired t-test (*P< 0.05,**P< 0.01,***P< 0.001, ns-non-significant).

