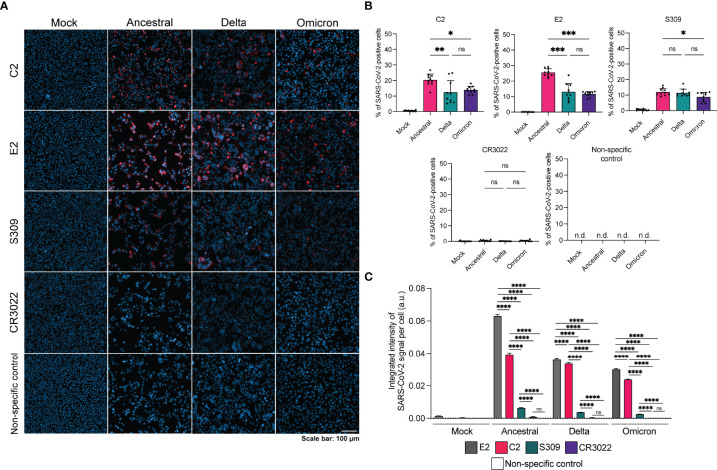
Figure 3.
Detection of SARS-CoV-2 variants by N-specific nanobodies via IFA. (A) Representative IFA images of infected Vero E6 cells stained with antibody or nanobody (red) and Hoescht stain (blue). Non-specific control is a Nipah F specific mAb 5B3. (B) Quantification of percentage of SARS-CoV-2 positive cells per region of interest (n=10) for each staining method. (C) Integrated intensity of SARS-CoV-2 signal per cell per strain for each staining method. Number of cells analyzed per condition is as follows: mock infected, E2 n=36,393; mock infected, C2 n=34,712; mock infected, S309 n=36,360; mock infected, CR3022 n=35,700; mock infected, non-specific n=37,166; ancestral, E2 n=9621; ancestral, C2 n=9699; ancestral, S309 n=18,088; ancestral, CR3022 n=7650; ancestral, non-specific n=24,307; delta, E2 n=19,517; delta, C2 n=18,359; delta, S309 n=23,476; delta, CR3022 n=19,104; delta, non-specific n=27,871; omicron, E2 n=19,359; omicron, C2 n=29,133; omicron, S309 n=11,565; omicron, CR3022 n=26,210; omicron, non-specific n=22,892. Statistics were performed using a one-way ANOVA with Tukey’s multiple comparisons test where *, p < 0.05, **, p < 0.005, ***, p < 0.001, ****, p < 0.0001, ns, non-significant and n.d., not detected.

