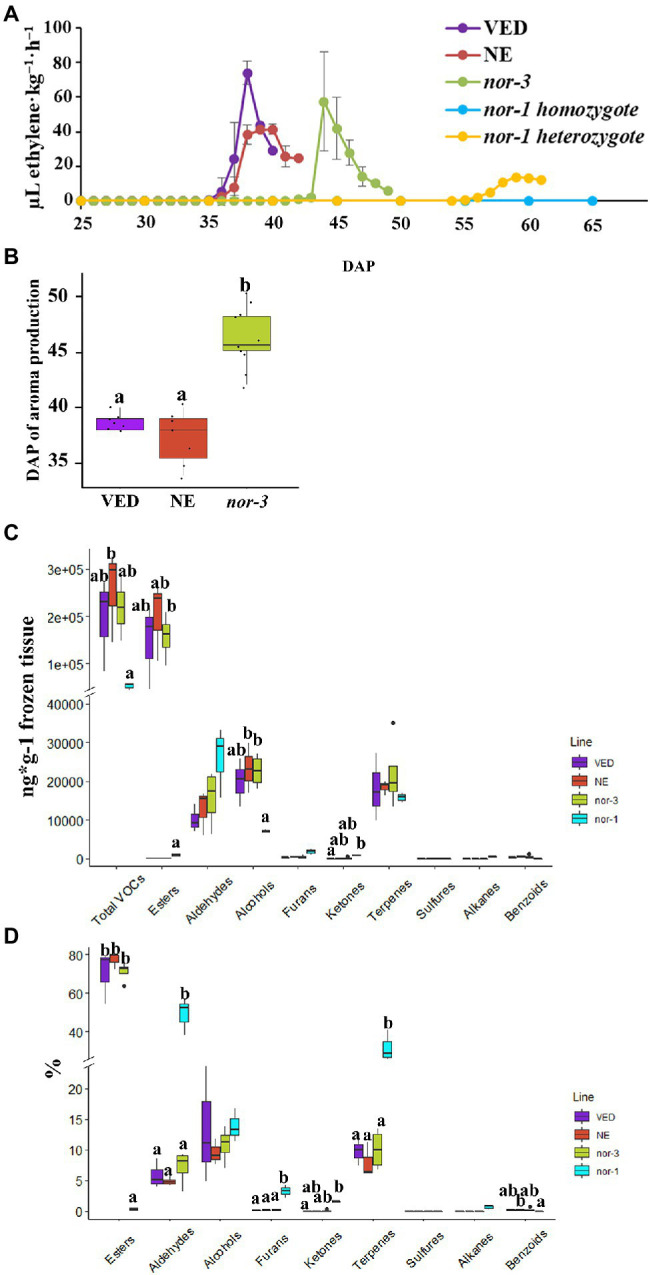
Figure 2.

Ethylene production and volatile profile in nor mutants. (A) Ethylene production in VED, NE (non-edited control), nor-3, nor-1 homozygote, and nor-1 heterozygote according to days after pollination (DAP). Means are plotted ±SD (n = 5) except nor-1 heterozygote (n = 1). (B) Phenotypic comparison of aroma production in VED, NE, and nor-3 at harvest. Lower case letters indicate significant differences (p < 0.05, n > 5). (C,D) Relative volatile content in VED, NE, nor-3, and nor-1 at harvest by mass (C) and mass percentage (D). Lower case letters indicate significant differences (p < 0.05, n = 3); large size black dots represent outliers.
