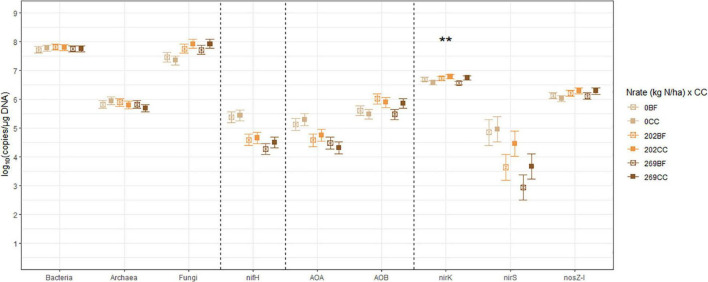
FIGURE 4.
The treatment means of soil microbial marker genes in (log10 copies/μg DNA), including bacterial (Bacteria) and archaeal (Archaea) 16S rRNA, fungal ITS region (Fungi), nifH, archaeal (AOA) and bacterial (AOB) amoA, nirK, nirS, and nosZ-I separated by the interactions between N fertilization rate (Nrate) and cover cropping (CC), with their standard errors of the mean as whiskers. The asterisks indicate the probability value of the treatment effect from analysis of variance (**p < 0.05). Nrate treatment levels were: 0, 202, and 269 kg N/ha. CC treatment levels were bare fallow control (BF) and hairy vetch and cereal rye cover crop mixture (CC).

