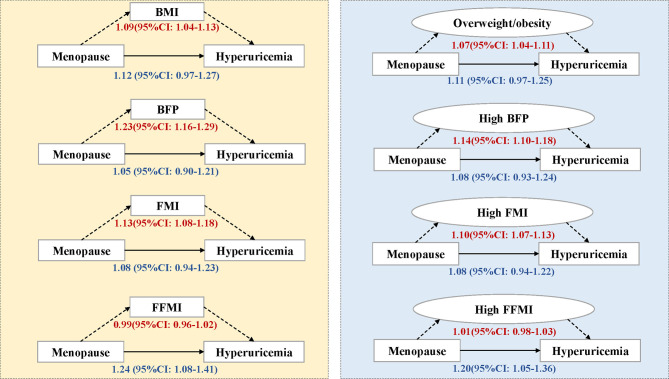
Figure 3.
Mediation analysis of body composition on the association between menopause and hyperuricemia. The number represents odds ratios and their 95% confidence intervals in the direct or indirect effect estimates. BMI, body mass index, kg/m2; BFP, body fat percentage, %; FMI, fat mass index, kg/m2; FFMI, fat free mass index, kg/m2; CI, confidence interval. Overweight/obesity refers to BMI≥24, high BFP refers to BFP>32%, high FMI refers to FMI>7, and high FFMI refers to FFMI>15.

