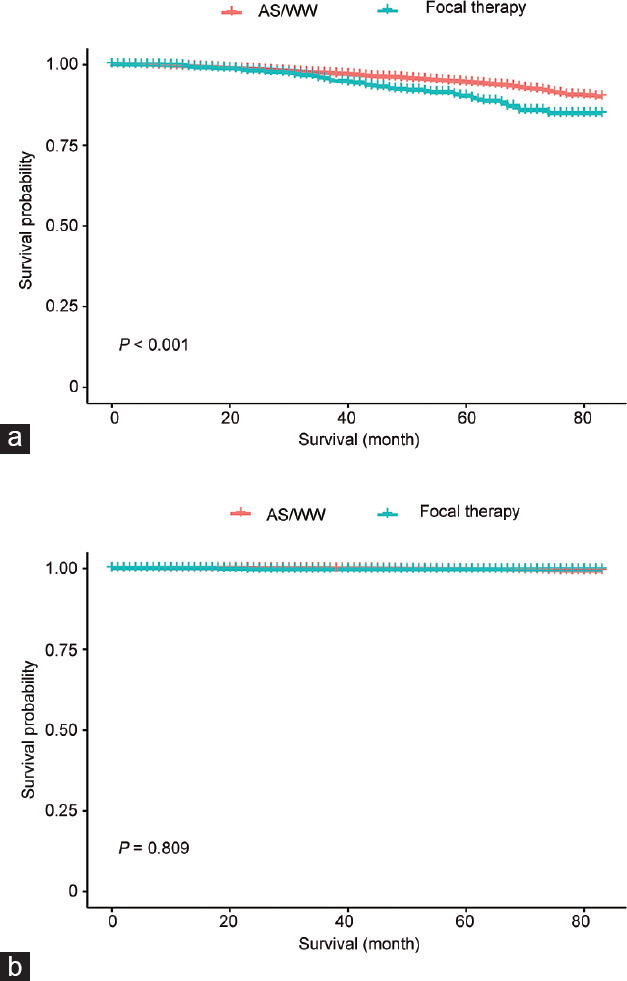
Figure 3.

Kaplan–Meier survival curve of OM and CSM. (a) Kaplan–Meier survival curve of OM in the comparison of AS/WW and focal therapy. (b) Kaplan–Meier survival curve of CSM in the comparison of AS/WW and focal therapy. OM: overall mortality; CSM: cancer-specific mortality; AS: active surveillance; WW: watchful waiting.
