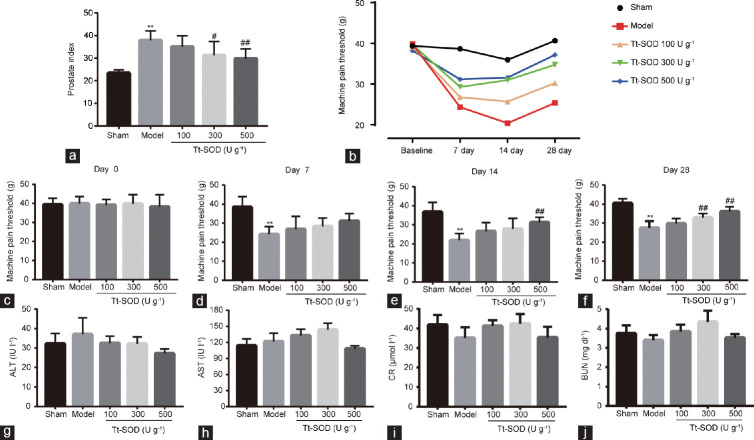
Figure 1.
Comparison of prostate index and mechanical allodynia in sham group, model group, Tt-SOD 100 U g−1 (low-dose) group, Tt-SOD 300 U g−1 (medium-dose) group, and Tt-SOD 500 U g−1 (high-dose) group. (a) Comparison of prostate index in each group; (b) change in mechanical allodynia in each group over 28 days; (c) comparison of pain thresholds in each group before the experiments; (d) comparison of pain thresholds in each group on day 7; (e) comparison of pain thresholds in each group on day 14; (f) comparison of pain thresholds in each group on day 28; serum (g) ALT, (h) AST, (i) CR, and (j) BUN levels. Results are expressed as mean ± standard deviation (n = 8). **P < 0.01, the indicated group versus sham group; #P < 0.05 and ##P < 0.01, the indicated group versus model group. ALT: alanine transaminase; AST: aspartate transaminase; CR: creatinine; BUN: blood urea nitrogen; Tt-SOD: Thermus thermophilic-superoxide dismutase.

