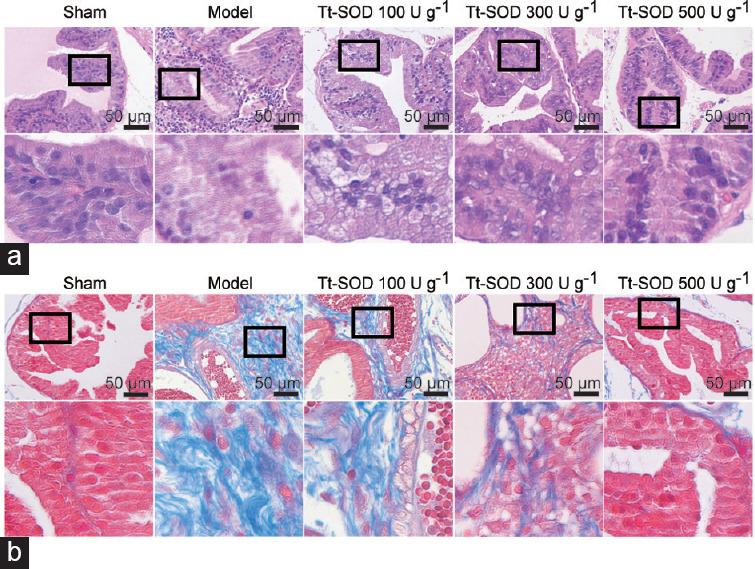
Figure 2.

Representative H&E and Masson staining images from sham group, model group, Tt-SOD 100 U g−1 (low-dose) group, Tt-SOD 300 U g−1 (medium-dose) group, and Tt-SOD 500 U g−1 (high-dose) group. (a) 400× magnification image of H&E staining for each group (upper), and extended field image (lower) in the black box of the upper image; (b) 400× magnification image of Masson staining from each group. Lower image is an extended field image in the black box of the upper image. H&E: hematoxylin and eosin; Tt-SOD: Thermus thermophilic-superoxide dismutase.
