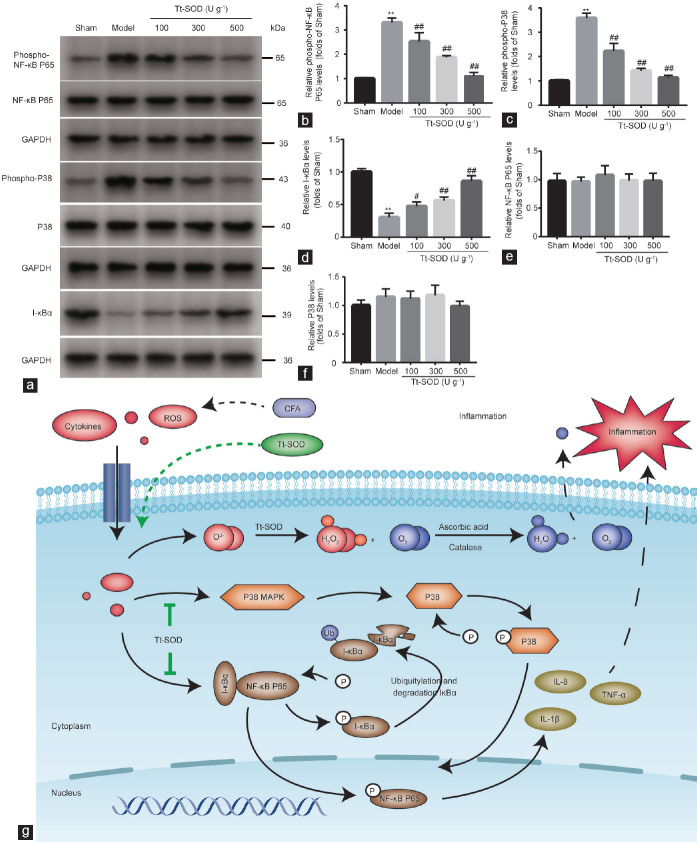
Figure 6.
Western blotting analysis of sham group, model group, Tt-SOD 100 U g−1 (low-dose) group, Tt-SOD 300 U g−1 (medium-dose) group, and Tt-SOD 500 U g−1 (high-dose) group, and schematic diagram. (a) Representative immunoblots for each group. Quantification of (b) phospho-NF-κB P65, (c) phospho-P38, (d) I-κBα, (e) NF-κB P65, and (f) P38 levels in each group. (g) Schematic diagram showing protective signaling of Tt-SOD in a CFA-induced CP/CPPS rat model. **P < 0.01, the indicated group versus sham group; #P < 0.05 and ##P < 0.01, the indicated group versus model group. Tt-SOD: Thermus thermophilic-superoxide dismutase; CFA: complete Freund's adjuvant; CP/CPPS: chronic prostatitis/chronic pelvic pain syndrome; TNF-α: tumor necrosis factor-α; IL-1β: interleukin-1β; IL-8: interleukin-8; GAPDH: glyceraldehyde-3-phosphate dehydrogenase; ROS: reactive oxygen species; MAPK: mitogen-activated protein kinase; I-κBα: inhibitor of nuclear factor-κBα; NF-κB: nuclear factor-κB.

