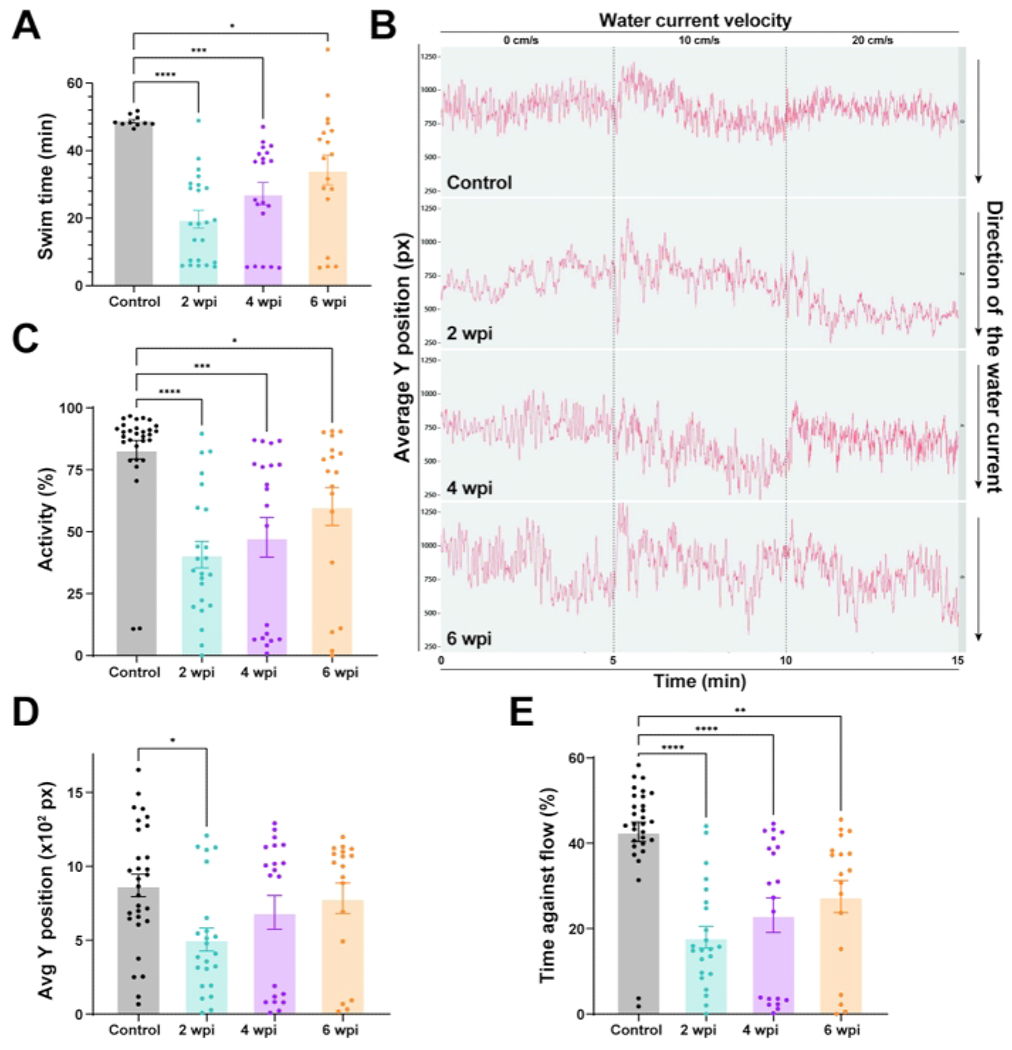
Figure 3: Functional recovery in wild-type zebrafish after spinal cord injury.

(A) Motor function determined by swim endurance assays for wild-type zebrafish at baseline and 2, 4, and 6 wpi. Dots denote individual animals from two independent experiments. (B) Swim behavior assays tracked wild-type zebrafish under low water current velocities. The average Y position is shown at each time point throughout tracking (0 cm/s for 5 min, 10 cm/s for 5 min, and 20 cm/s for 5 min). (C–E) Percent activity (C), average Y position in the tunnel (D), and time swam against the flow (E) were quantified at 20 cm/s. For all quantifications, two independent experiments are shown. n = 30 in the pre-injury condition; n = 23 at 2 wpi, n = 20 at 4 wpi, n = 18 at 6 wpi. One-way ANOVA was used for statistical analyses. Error bars represent the Standard Error of the Mean (SEM). *P < 0.05; **P < 0.01; ***P < 0.001; ****P < 0.0001. Please click here to view a larger version of this figure.
