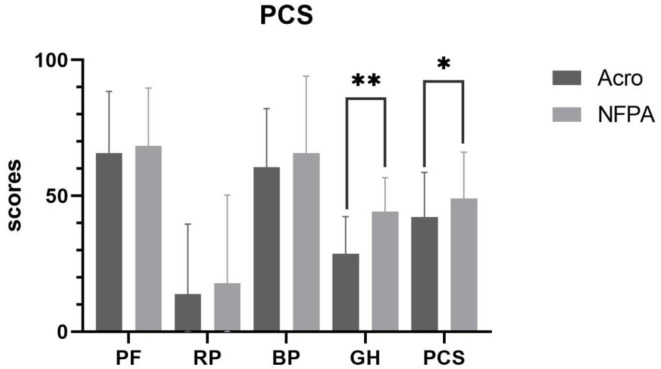
Figure 2.
Physical component summary score in patients with acromegaly vs. those with NFPA. Data are presented as mean ± standard deviation. PF, physical functioning; RP, role-physical; BP, bodily pain; GH, general health; PCS, physical component summary. **Correlation is significant at the 0.01 level (2-tailed). *Correlation is significant at the 0.05 level (2-tailed).

